Explorer
Turn Vorne data into decisions you can defend.
Explorer takes what your boards already record and puts it into dashboards built for how plants actually ask questions: OEE, TEEP, Availability, Performance, and Quality, down to reason codes, reject reasons, and downtime, across every device from one place.
Manufacturing intelligence
Every metric your plant argues about, in one place.
Explorer is built to optimize your production landscape by making Overall Equipment Effectiveness readable. Built-in dashboards display OEE, TEEP, Availability, Performance, and Quality, and let you track everything from reason codes to reject reasons and downtime from one centralized platform.
Capabilities
Powerful features for modern manufacturing.
Everything you need to optimize operations, reduce waste, and drive continuous improvement.
A curated dashboard set
Thirteen dashboards tailored to Vorne V2 board structure, from Executive Summary to Six Big Losses, and fully customizable.
Drag-and-drop interface
Easily customize and build charts with an intuitive, no-code interface.
Flexible deployment
Choose between on-premises or cloud installation for optimal flexibility.
Customizable security options
Support for both secured and open deployments based on your needs.
Virtual Stations
View data from V2, V1, and Virtual Stations.
See Work Tracker →Comprehensive support
Benefit from thorough documentation and the OEE IntelliSuite support team.
Integration and scale
It sits on top of the plant you already have.
Explorer brings Vorne devices, Virtual Stations, and integrated plant systems together into one reporting layer, then scales from a single machine to every site you run.
System compatibility
Custom API integrations, and compatible with MQTT or OPC systems.
MES
ERP
PLC
Scale and access
The same reporting layer, from one machine to every site you run.
Enterprise-wide scalability
From single machines to multi-site operations.
Cross-platform compatibility
Works seamlessly across web, mobile, and tablet.
Team collaboration
Role-based access for operators to executives.
Gallery
See Explorer in action
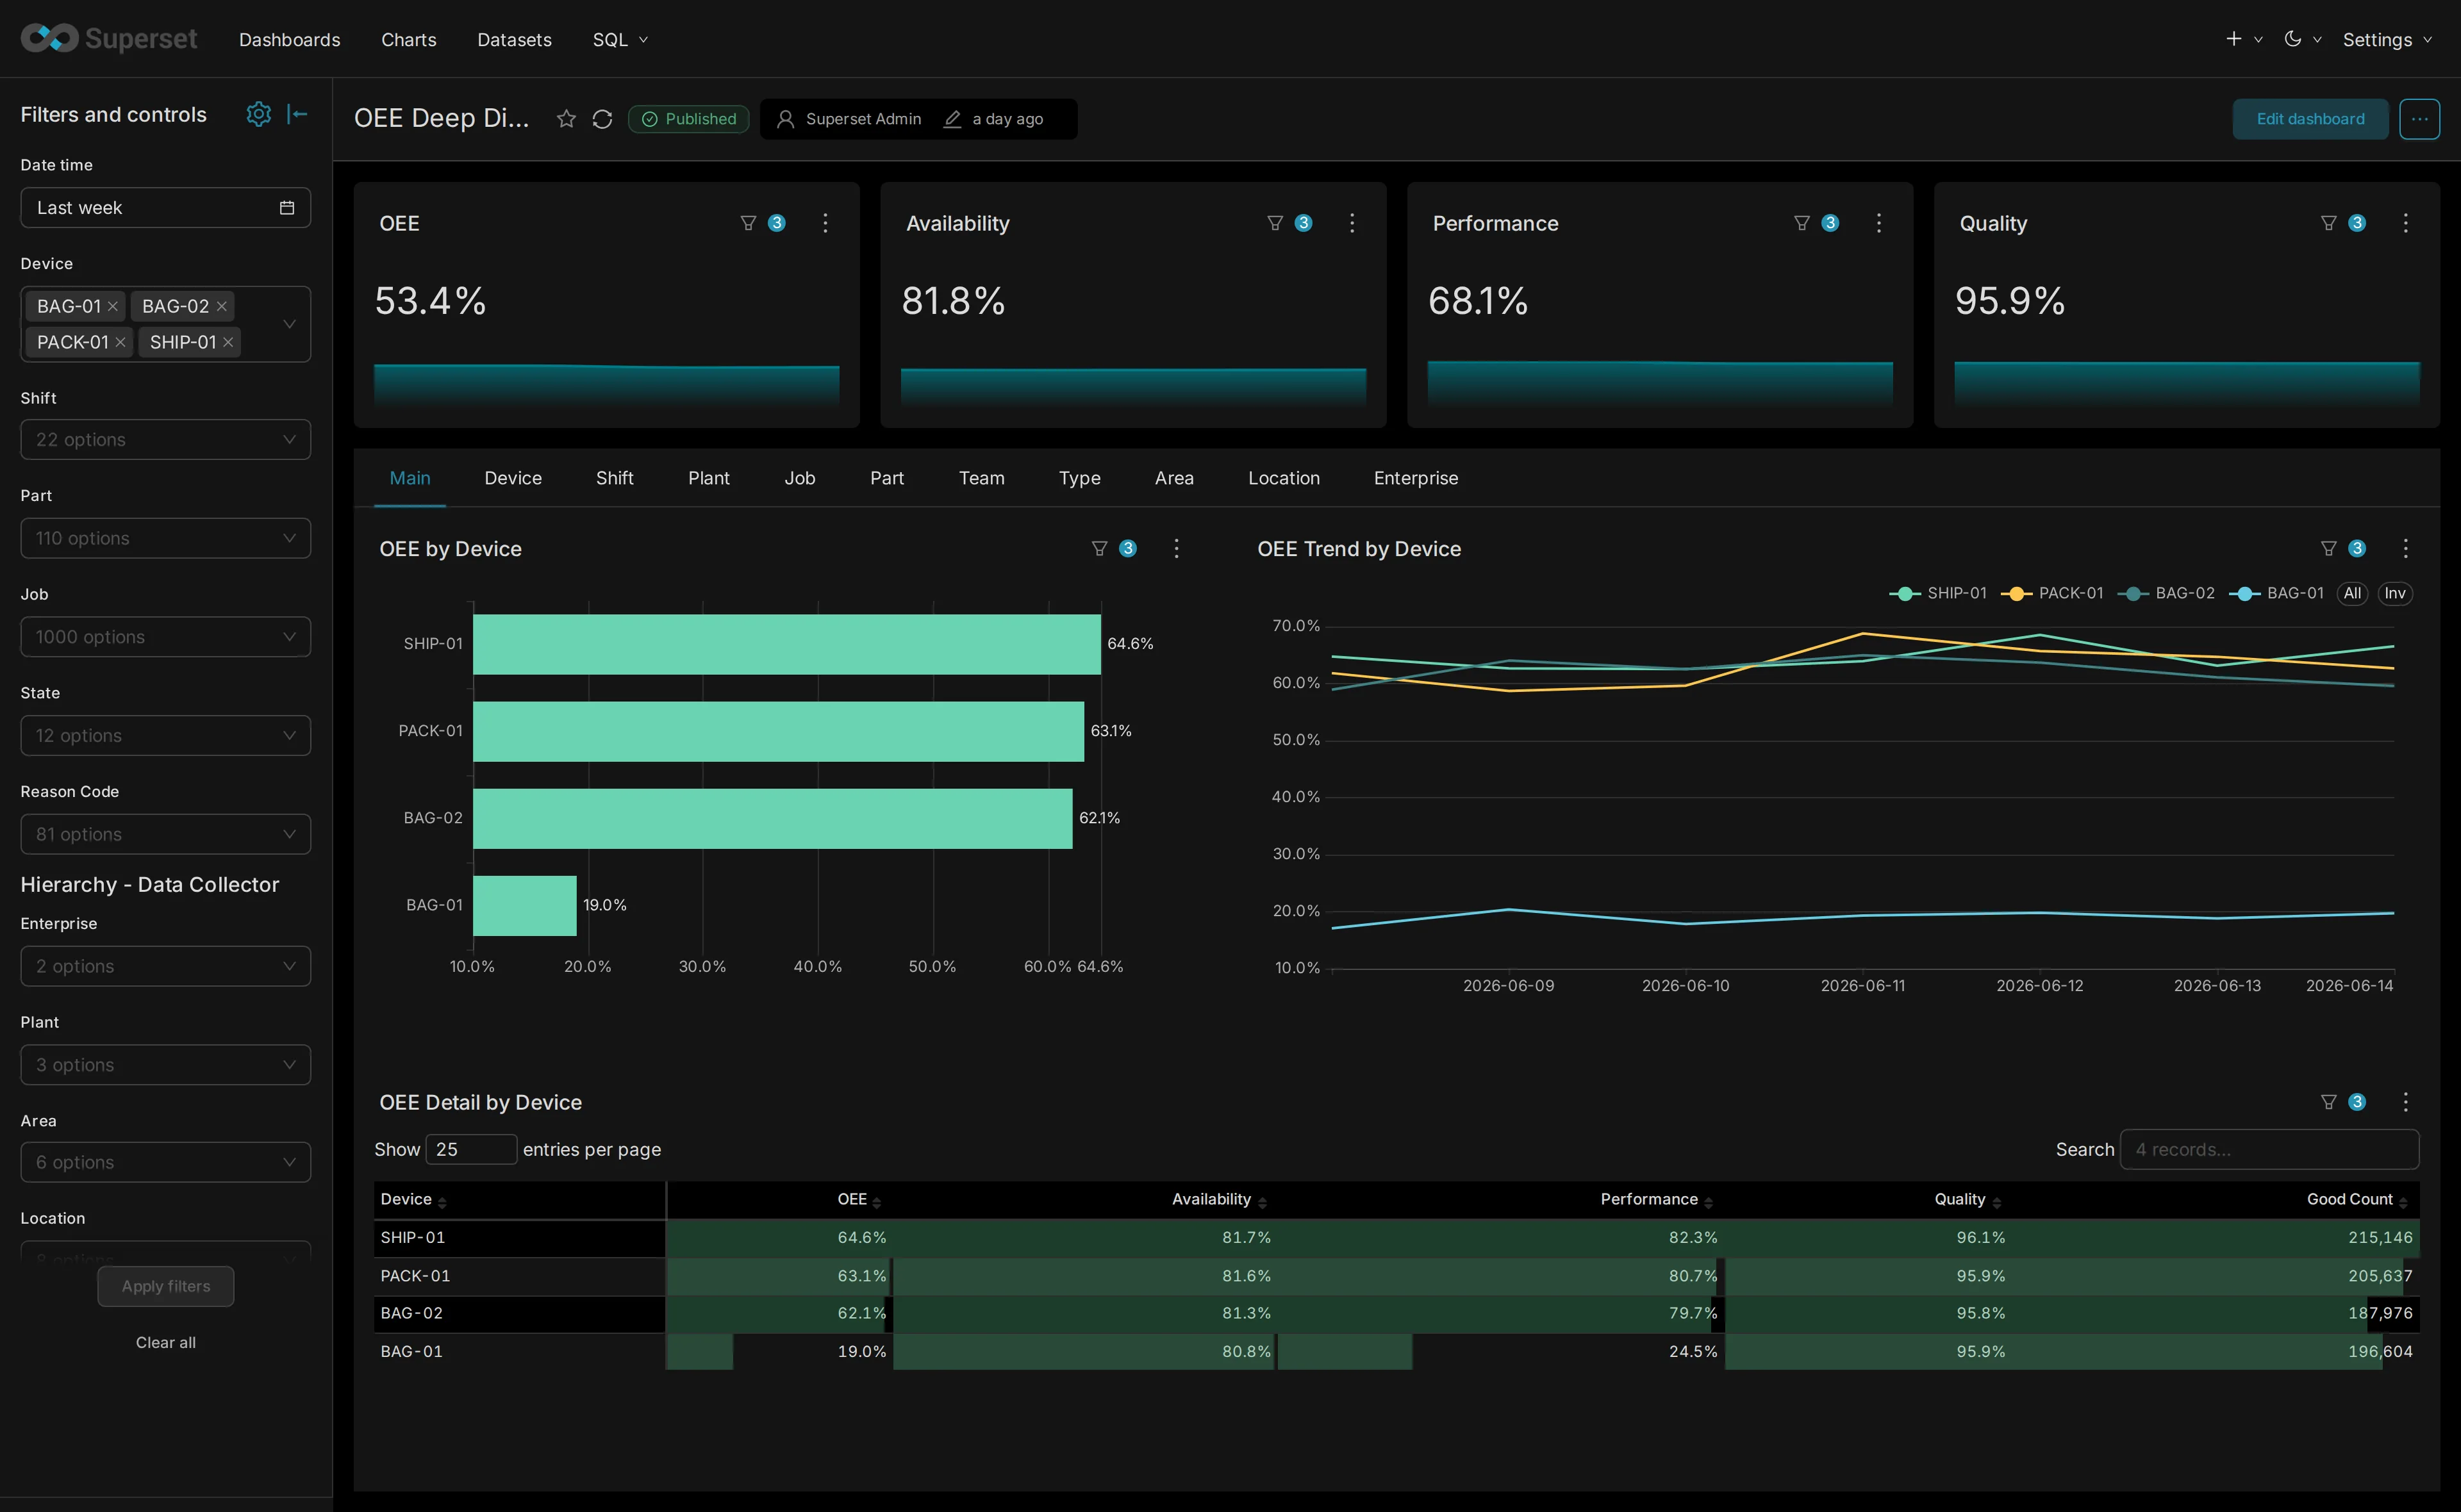
Real dashboards from live production data: full dashboards, per-chart detail across KPI, trend, comparison and table widgets, and a built-in dark theme. Click any image to explore.
Walkthrough
Watch Explorer answer a question.
A short tour of the dashboard set, the chart builder, and how a plant-level number gets taken apart.
Already shipping
Employee punch data on the same dashboards.
Work Tracker punches land in Explorer's employee views. Efficiency, availability, quality, performance, and OEE break down by individual without a separate place to look.
Individual employee punch visualization
Turn time punches into insights for scheduling, accountability, and labor efficiency beside the Vorne production history you already read in Explorer.
On the roadmap
What Explorer is getting next.
Two additions that extend the same dashboards rather than adding another place to look.
Opportunity costs of downtime
Extend costing into the opportunity cost of downtime: what lost capacity could have produced, by line, reason, and shift.
Multi-step and batch production tracking
Lines with multiple machines per line, and batch processes with sequential steps, analyzed against the same production history.
Resources
Learn more about Explorer
User Guide
A practical guide to reading and filtering your Explorer dashboards, with live screenshots in light and dark.
Read the guide →Interactive Brochure
The full Explorer overview: features, benefits, and where it fits in the suite.
View brochure → (opens in a new tab)Printable PDF
The same brochure, opened straight into your print dialog to save as a PDF.
Print to PDF → (opens in a new tab)Screenshot Gallery
Browse live Explorer dashboards, widgets, and tab views in light and dark themes.
View gallery →Put your Vorne data to work.
Book a demo and we will walk your own metrics through the dashboard set, then show you how to build one of your own.