
OEE Pulse
Keep Your Finger on the Pulse of Production. Real-Time Dashboards, Smart Alerts, and Actionable Reports for Every Machine on Your Floor.
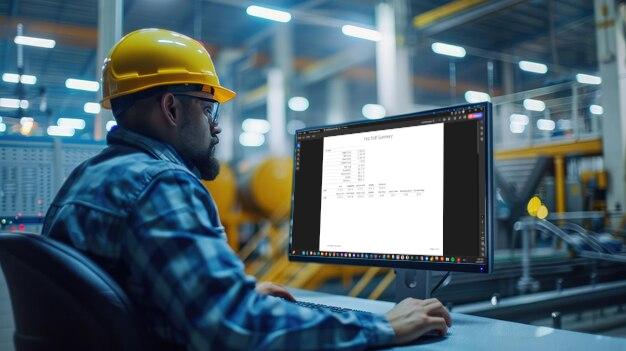

Complete Visibility, Zero Guesswork
Everything you need to monitor, analyze, and optimize production performance across your entire plant
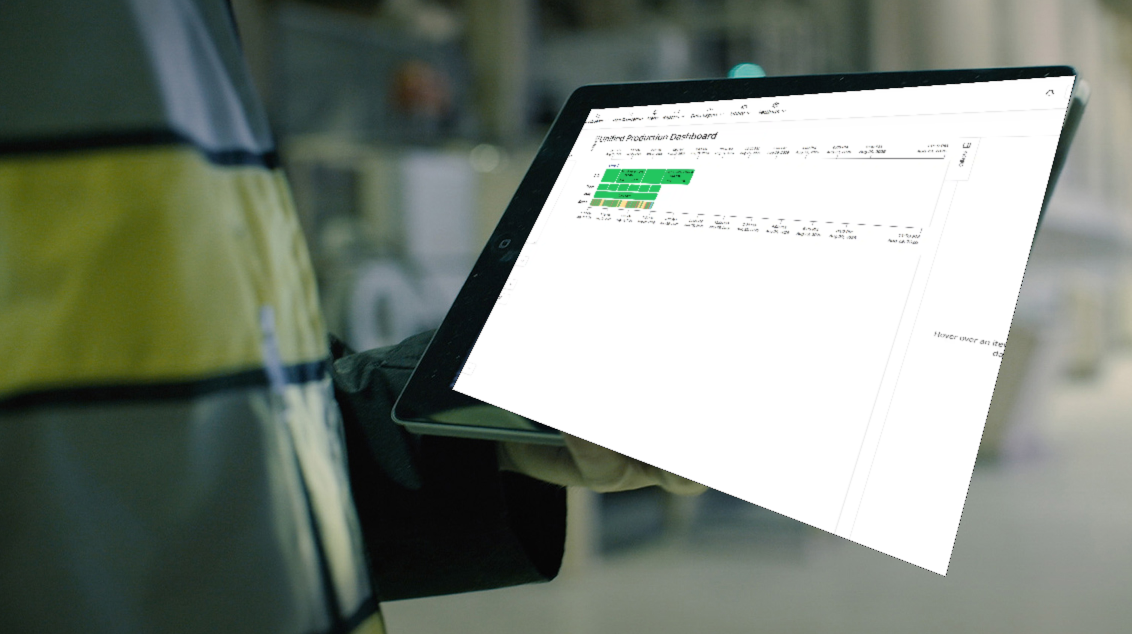
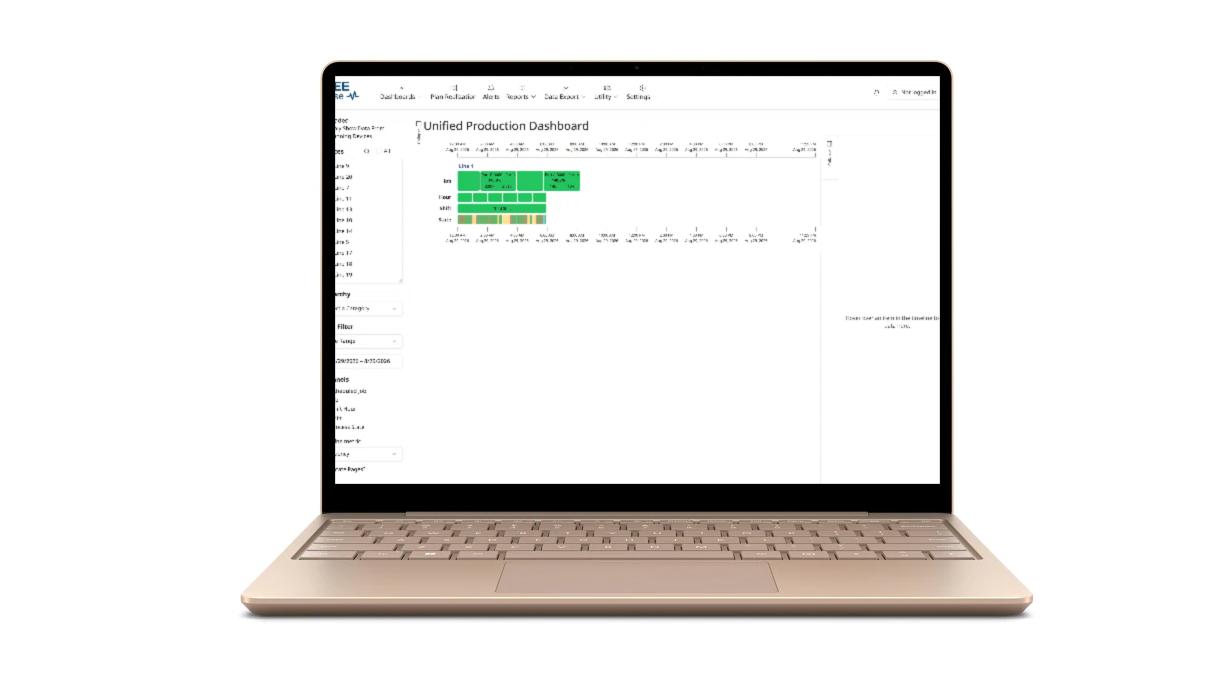
Unified Timeline Dashboard
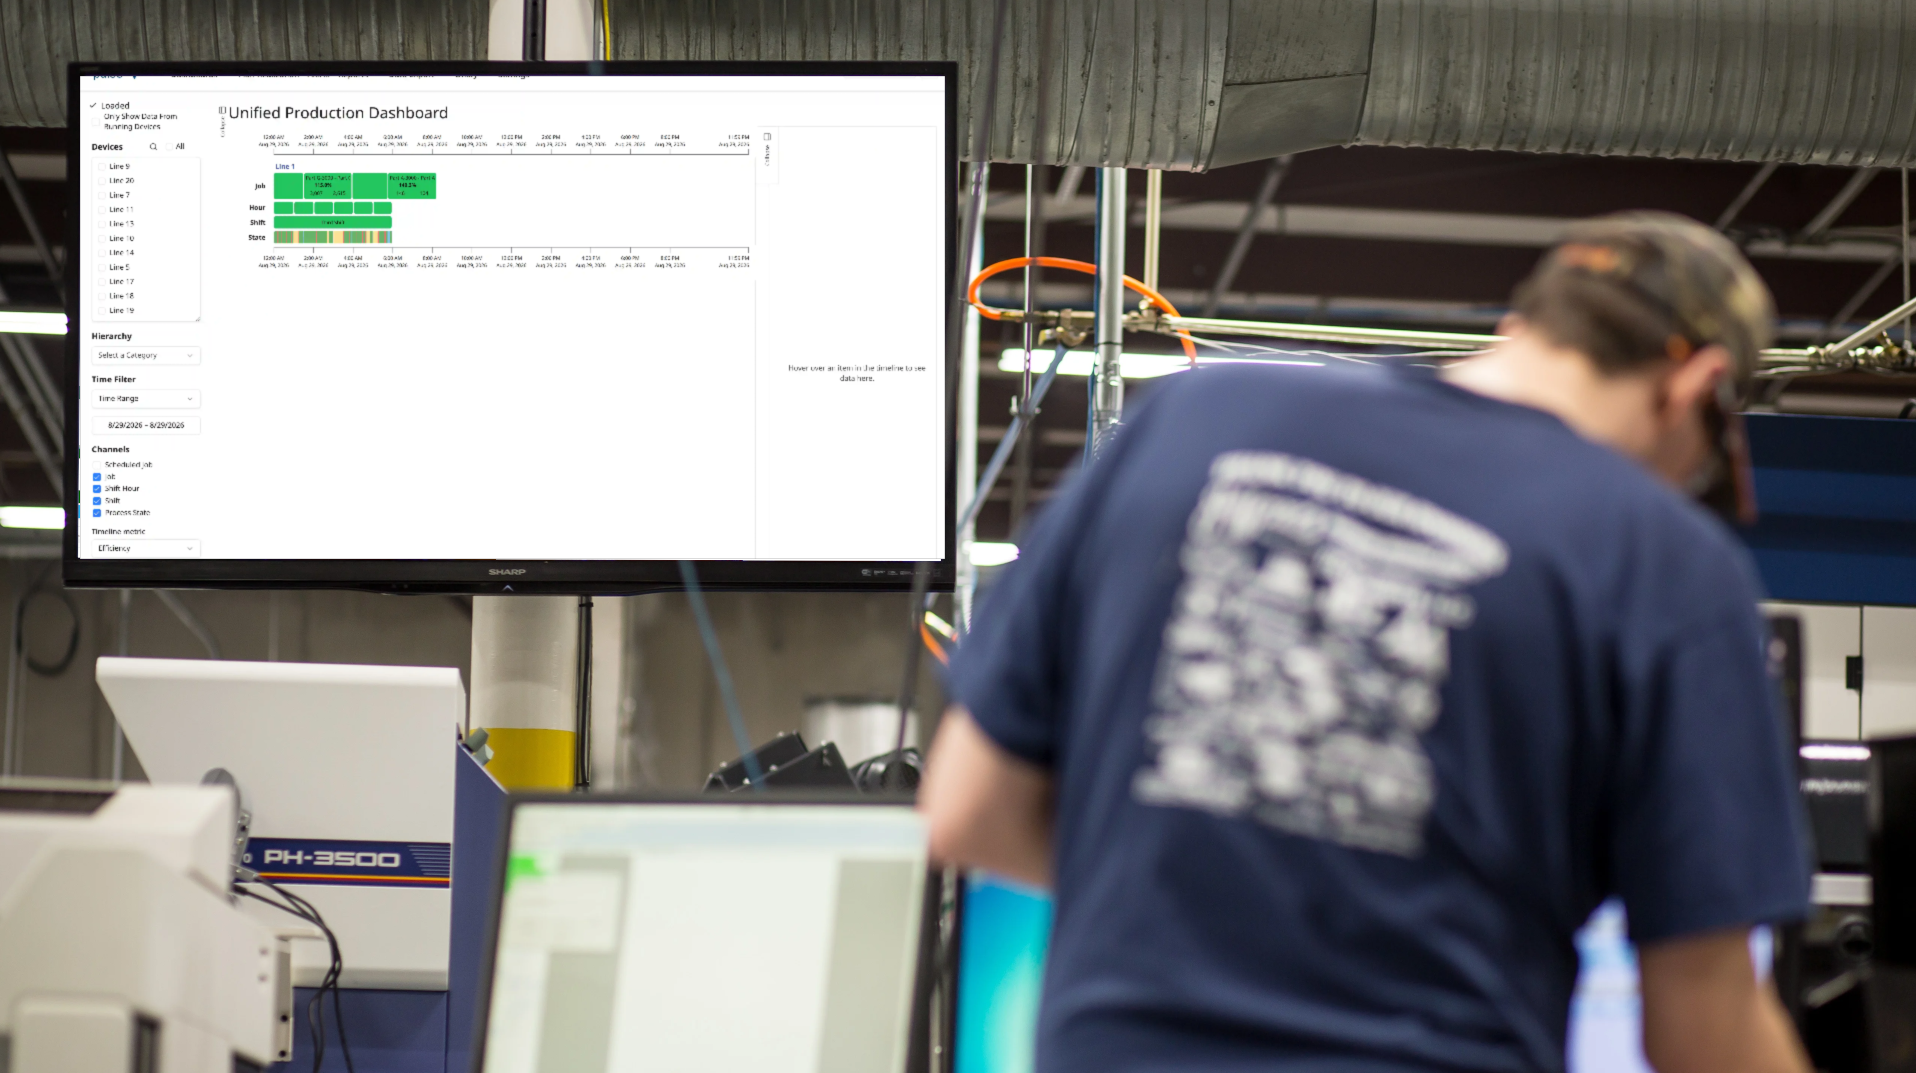
Jobs, shifts, process states, and schedule data for every device in a single real-time timeline, color-coded by performance, with the predicted end time on every running job. Hover any bar for who was punched on, or open the Employee Punch Timeline. Pick a date, shift, or rolling window.
Smart Alert Engine
Downtime thresholds, board-offline detection for active V2 Vorne boards, process state changes, and OEE triggers, delivered by email, SMS, Teams, Slack, push, in-app alert, or an on-screen banner. Custom schedules, recipients and squelch times.
Reports and Data Export
Shift production, line and shift OEE, top losses, and the OEE waterfall. Export any report as PDF, or pull the underlying metrics and raw event data straight to CSV or Excel.
Day at a Glance
Get a full-day production summary for any device with timeline, state distribution, OEE trend charts, and downtime Pareto analysis in one view. The cycles chart separates run, small stop, partial and slow cycles, and clamped outliers keep one spike from flattening the cycle time chart.
Plan Realization
Compare actual output against planned schedules across all devices. See run-to-schedule minutes and realization percentages at a glance.
Comments and Analysis
Add operator notes to any timeline event, then read every comment across every device in one report, with automatic summaries that surface the themes behind the downtime.
Monitor From Anywhere
TV-ready rotation mode for the shop floor, or check in from your desk or mobile device
Your Entire Production Floor,
One Dashboard Away
Vorne hardware captures the data. OEE Pulse makes it visible, actionable, and shareable. Stop walking the floor to check boards and start deciding from dashboards that update themselves.
Five Timeline Channels, One Complete Picture
Every perspective on production performance, synchronized in real time
Schedule Job
View planned vs. actual with run-to-schedule tracking
Job
Track active and completed jobs with efficiency scoring
Shift Hour
Hourly performance breakdown across each shift
Shift
Full shift summaries with OEE and count data
Process State
Running, down, planned stop, and unscheduled states
Instant Awareness
See the moment a machine goes down or a job falls behind. Alerts reach the right people by email, SMS, Teams, Slack, push, in-app alert, or on-screen banner.
Data-Driven Shifts
Shift summary reports are automatically delivered at the end of every shift. Supervisors start each day with a clear picture of what happened overnight.
Pinpoint Your Losses
Pareto charts, top-loss reports, and the OEE waterfall show where OEE is going. Slow-cycle detection catches speed loss that never trips a downtime event.
Enterprise Hierarchy
Filter by enterprise, plant, location, line, area, or machine type. Multiple selections within each level let you compare across departments instantly.
Seamless Integration With Your Systems



 Dynamics



 Excel / CSV
REST API
Modbus
Excel / CSV
REST API
Modbus
 OPC
Email
SMS
OPC
Email
SMS
 Slack
Slack
From Raw Data to Real Decisions
OEE Pulse connects directly to your Vorne XL hardware and turns raw production events into an interactive, real-time dashboard. Instead of walking the floor to check individual boards, supervisors see every machine's status, job progress, and OEE from one screen, filtered by shift, time range, or anywhere in your device hierarchy.
More in Pulse
Beyond the live dashboard, the work that happens after the shift ends
Data Export
Metrics and raw events to CSV, Excel, or PDF, with your filters applied
Comments Report
Every operator note across every device, summarized automatically
Anomaly Detection
Sign up for automatic notice when a device behaves unlike itself
Bulk Edit
Correct counts and reason codes across many events at once
Comparison Tool
Put two periods, shifts, or devices side by side
The OEE IntelliSuite Ecosystem
Pulse is one part of a connected suite. Here is what it works with today.
Advisor
Ask about your production data in plain language and get an answer as a number, chart, or sortable table, grounded in your own data.
OEE Explorer
Deep historical analysis with trend, drill-down, and cross-device comparison, plus employee dashboards built from Work Tracker data.
BOM
The job packet, made virtual. Job metrics, bill of materials, and labor detail in one view alongside the run.
Work Tracker
The Employee Punch Timeline shows who was on each machine, and OEE metrics break down by employee.
Multi-step and Batch Tracking
Multi-machine lines and sequential batch steps on the live timeline: step starts and ends, one flowing into the next.
Opportunity Costs of Downtime
Price not only what a stop cost, but what that lost capacity could have produced.
Try Pulse yourself at pulse.lite-demo.oeeintellisuite.com. A full guided demo on your own production data is available on request.