
OEE Explorer
Transform Vorne Data into Actionable Insights with Powerful Visualizations, Custom Dashboards, and Drag-and-Drop Analytics.

Powerful Features for Modern Manufacturing
Everything you need to visualize, analyze, and optimize your production data
A Curated Dashboard Set
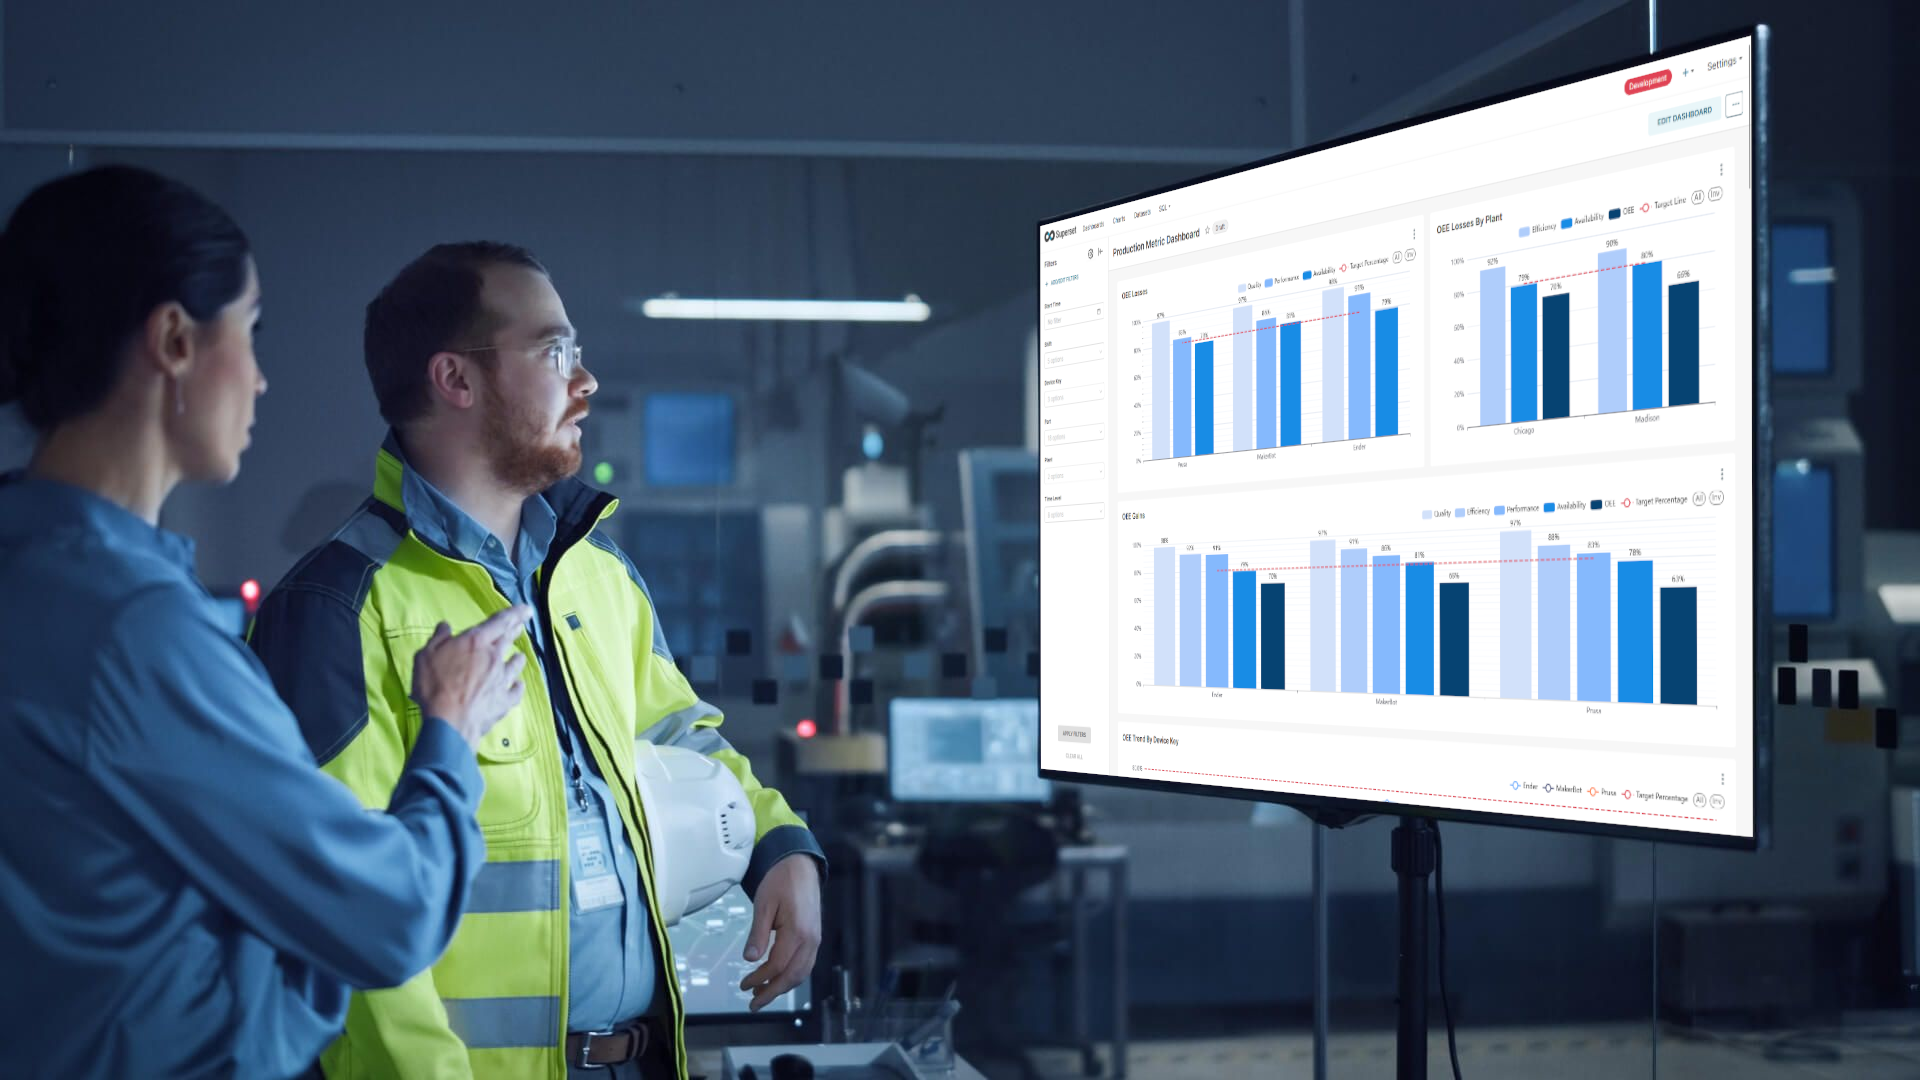
Thirteen dashboards built for Vorne's V2 board structure, including Executive Summary, OEE Deep Dive, Downtime, Quality, Six Big Losses, Labor, and TEEP.
Every Chart Type You Need
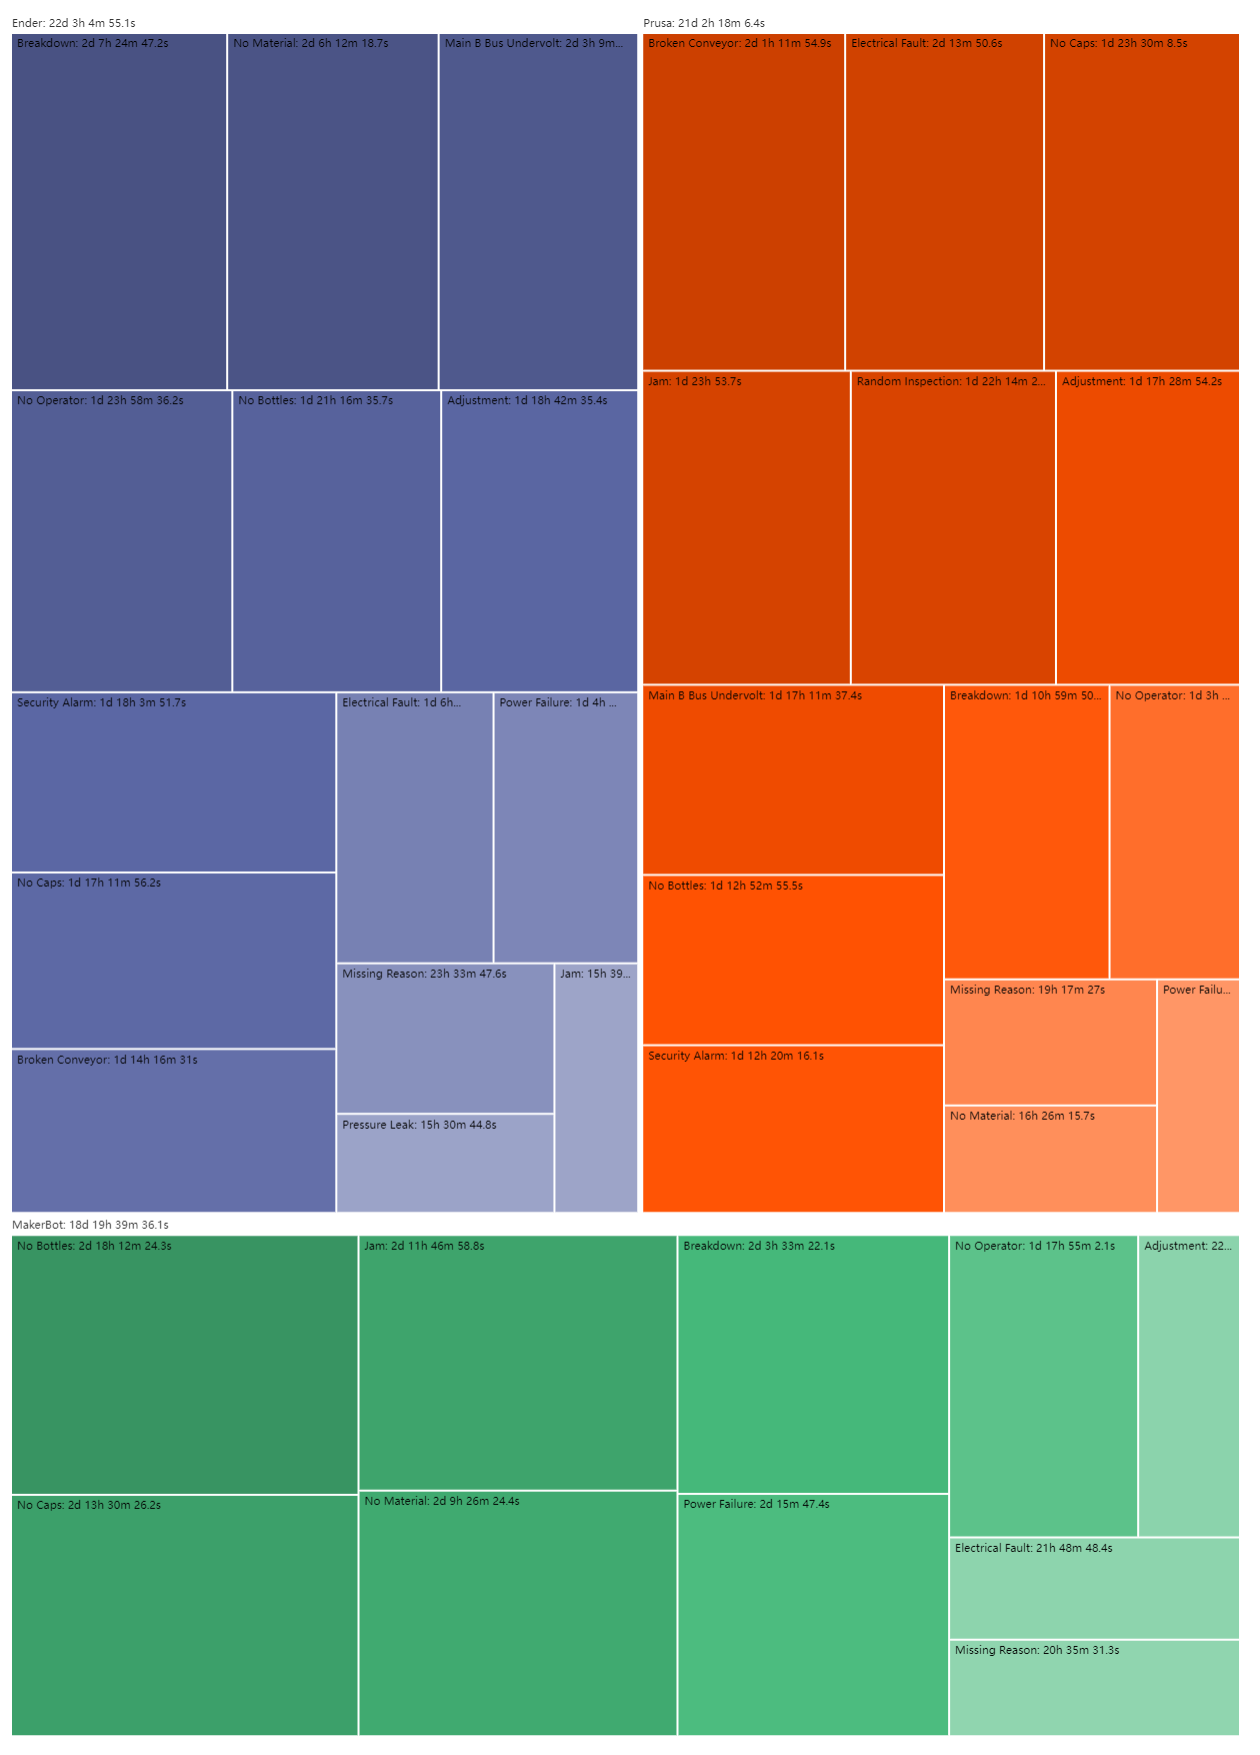
Pareto charts, trend lines, heatmaps, bar and scatter plots, pivot tables, KPI bands, and detail tables with in-cell bars. Pick the view that answers the question.
Drag-and-Drop Interface
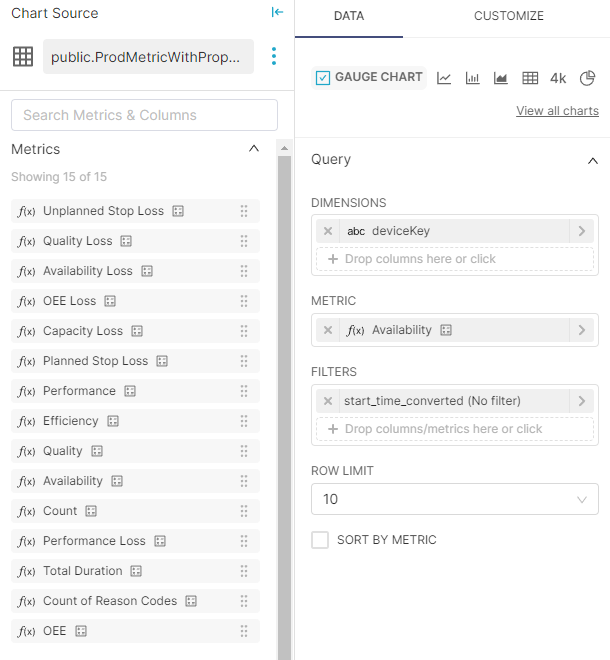
Build and customize charts with an intuitive, no-code interface. Create the exact visualizations your team needs.
Employee Dashboards
With Work Tracker, punch data lands in Explorer. Analyze labor hours, utilization, and OEE broken down by employee to spot top performers and training gaps.
Virtual Stations
View data from V2, V1, and Virtual Stations. Capture OEE data from any work center, even without a Vorne device.
Deploy It Your Way
On-premises or cloud, secured or open. Role-based access puts the right dashboards in front of the right people, and your data stays where you want it.
Visualize Your Data, Your Way
From heatmaps to custom charts - explore your production data on any device
Your Vorne Data Deserves
More Than Spreadsheets
Vorne devices capture incredible production data, but getting at it should not mean exporting CSVs and building pivot tables. Explorer turns raw Vorne data into interactive dashboards that drive real decisions.
Unlock the Full Potential of Your Vorne Data
Explorer extends your Vorne investment with powerful analytics and visualization
Historical Trend Analysis
Go beyond real-time snapshots. Heatmaps, trend lines, and Pareto charts reveal patterns across days, weeks, and months of production data.
No-Code Chart Builder
Anyone can build custom visualizations without writing code. Drag and drop metrics, dimensions, and filters to create exactly the view your team needs.
Losses in Dollars
Add the Costing module and every loss carries a number finance recognizes: what downtime, rejects, slow running, and overtime actually cost.
People and Machines Together
Work Tracker punch data sits beside machine performance, so labor and output are read in one place instead of two systems that disagree.
Where the Data Comes From
 Virtual Stations


 Dynamics





 Excel / CSV
REST API
Modbus
Excel / CSV
REST API
Modbus
 OPC
OPC
Built-In Maintenance KPIs
Track MTTR (Mean Time to Repair) and MTBF (Mean Time Between Failures) out of the box. Shift from reactive firefighting to data-driven preventive maintenance planning.
Six Big Losses Dashboard
Instantly see which loss category - planned stops, small stops, cycle loss, rejects, or downtime - is your biggest improvement opportunity. Built for Lean and Kaizen teams.
Cross-Shift Heatmaps
Compare OEE performance across shifts, parts, and devices in a single color-coded heatmap. Spot underperforming combinations at a glance - no spreadsheet pivoting required.
From Raw Data to Real Decisions
OEE Explorer bridges the gap between the data your Vorne devices capture and the insights your team needs. Instead of exporting into spreadsheets or living with static reports, Explorer gives you a live analytics platform where every dashboard is one click from the chart underneath it.
The curated set covers OEE, TEEP, Availability, Performance, and Quality, and each dashboard drills down by shift, job, part, device, or plant hierarchy. Need something of your own? The drag-and-drop builder makes a new chart without a line of code, and any dashboard exports to CSV or Excel or shares as a link that carries your filters.
Connect Your Data Sources
Explorer connects to your Vorne devices, Virtual Stations, ERP systems, and databases - and to Work Tracker and Costing when you run them. Data flows automatically, with no manual exports.
Build Your Dashboards
Start with the curated set or build from scratch. Drag and drop charts, tables, and metrics onto your dashboard. Filter by line, shift, product, or any dimension that matters to your operation.
Drive Continuous Improvement
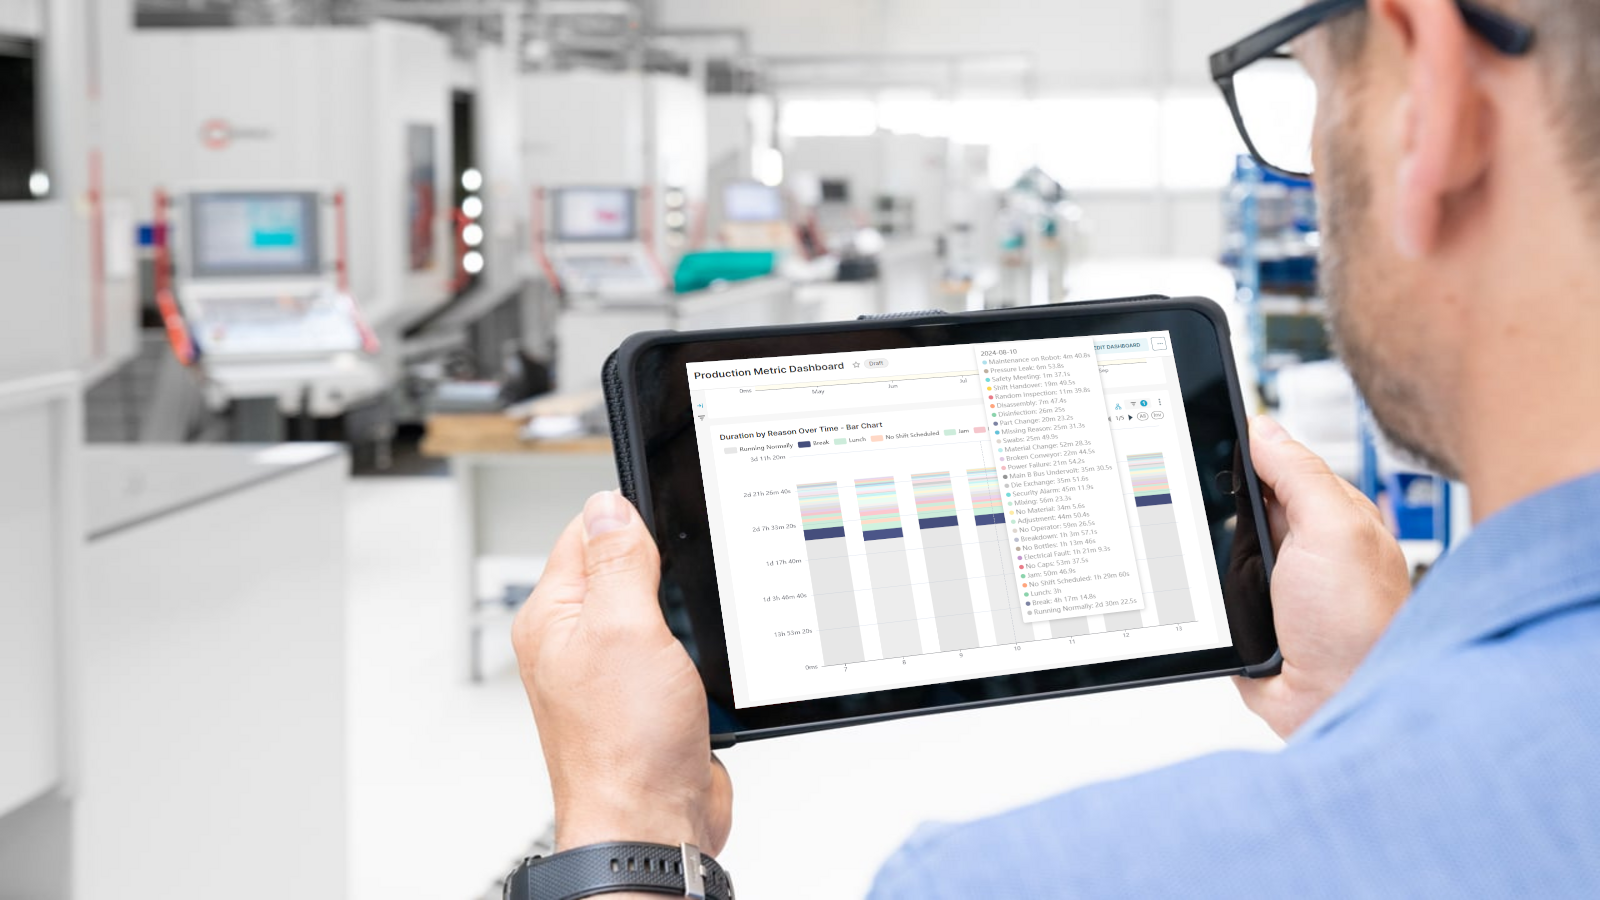
Share dashboards on TVs across the shop floor, review trends in morning meetings, or drill into anomalies from your tablet. The right data at the right time powers better decisions at every level.
The OEE IntelliSuite Ecosystem
Explorer gets richer with every product you add alongside it
Work Tracker
Employee punch data lands in Explorer's employee dashboards. Efficiency, availability, quality, performance, and OEE, broken down by individual.
Costing
Import production costs to see the financial impact of rejects, slow running, downtime, and overtime labor. Turn OEE percentages into dollars.
OEE Pulse
Live dashboards and the alerting engine. Set thresholds and get told by email, SMS, Teams, Slack, in-app alert, or on-screen banner.
Continuous Improvement
Give every agreed fix an owner, a status, and statistical proof that it held. The before-and-after comes straight from these dashboards.
A full guided demo on your own production data is available on request.