
OEE Costing
See What Your Losses Cost, and What Fixing Them Is Worth. With BOM, the Job Packet That Travels With Every Run.


Turn OEE Points Into Money
An OEE percentage starts an argument. A cost figure ends one. Costing prices every loss your plant already records, in your plant's own currency.
Downtime
Lost minutes by line, reason, and shift, valued at what that capacity was worth.
Rejects and Scrap
Each reject carries the material and run time already spent making it, by reason and product.
Slow Running
When cycles drift below standard rate, the output you gave up is costed as it happens.
Material
Priced against the job bill of materials, so overuse and variance show up as cost.
Labor and Overtime
Crew time mapped to the jobs that consumed it, with the premium overtime really carries.
Opportunity Cost
Capacity lost to stops and slow running, valued at what it could have produced.
Your Costs, Your Rules
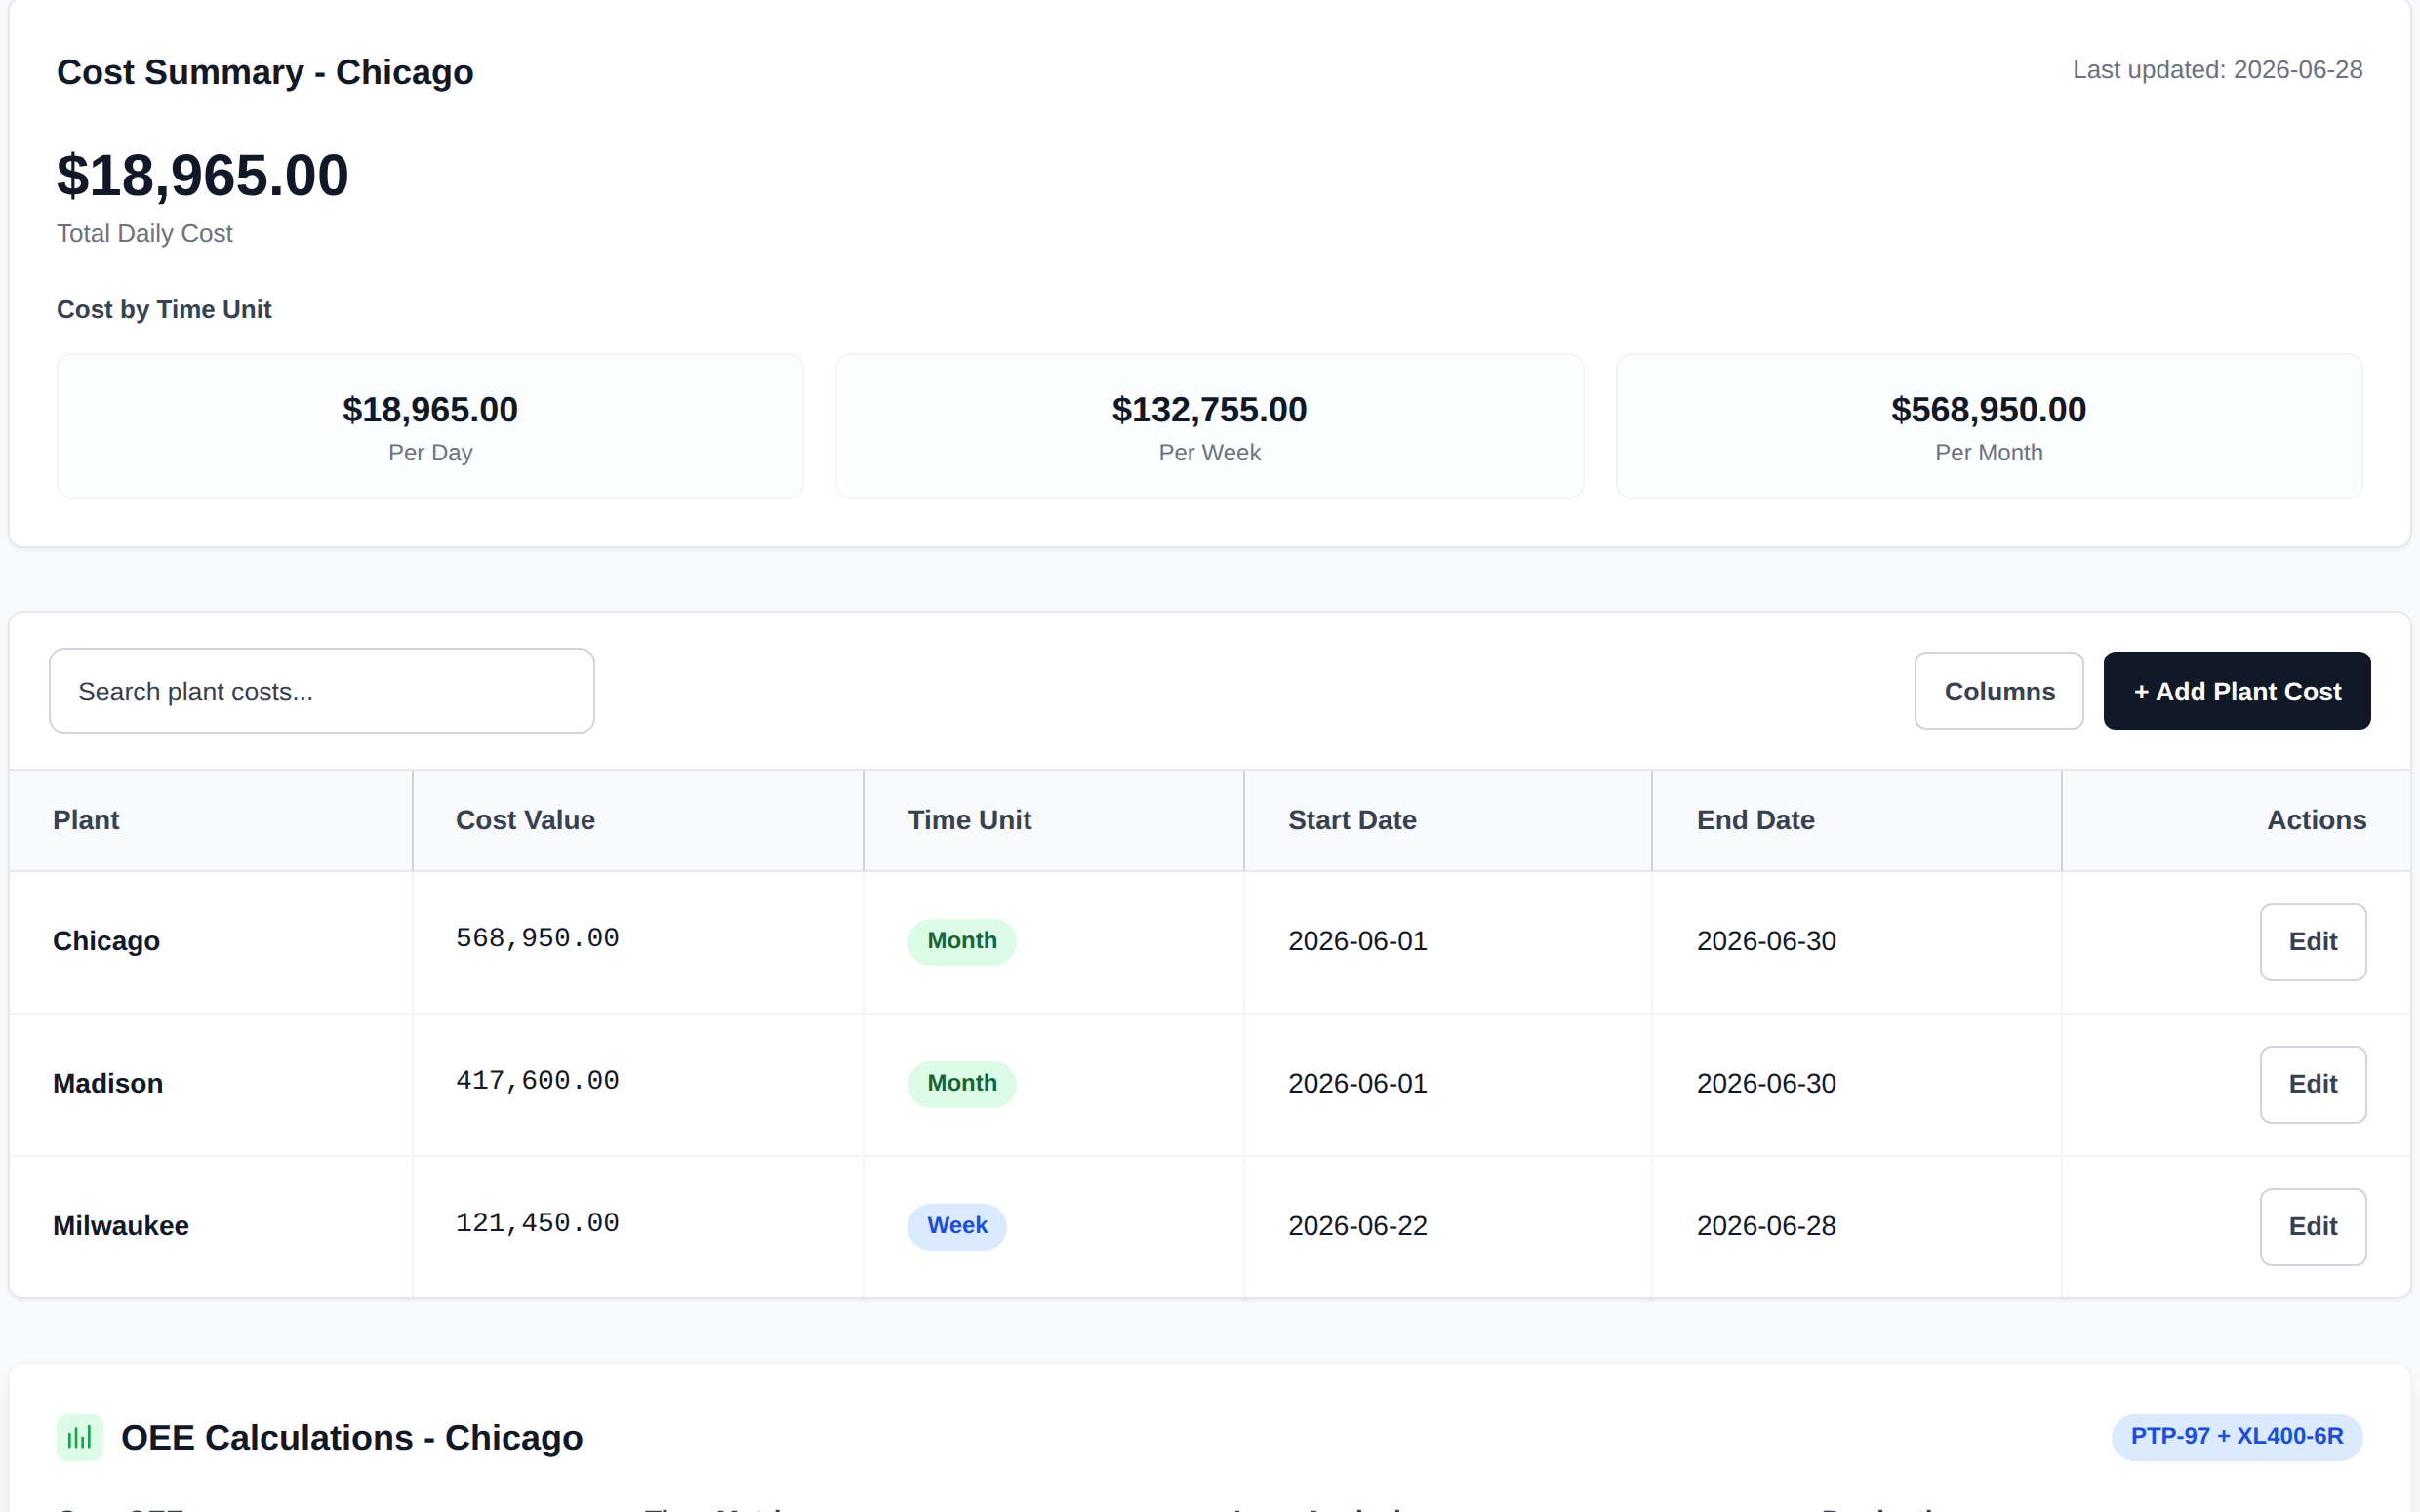
Plant cost tables, categories, and effective date ranges, so last year is priced at last year's rates
BOM: The Job Packet,
Made Virtual
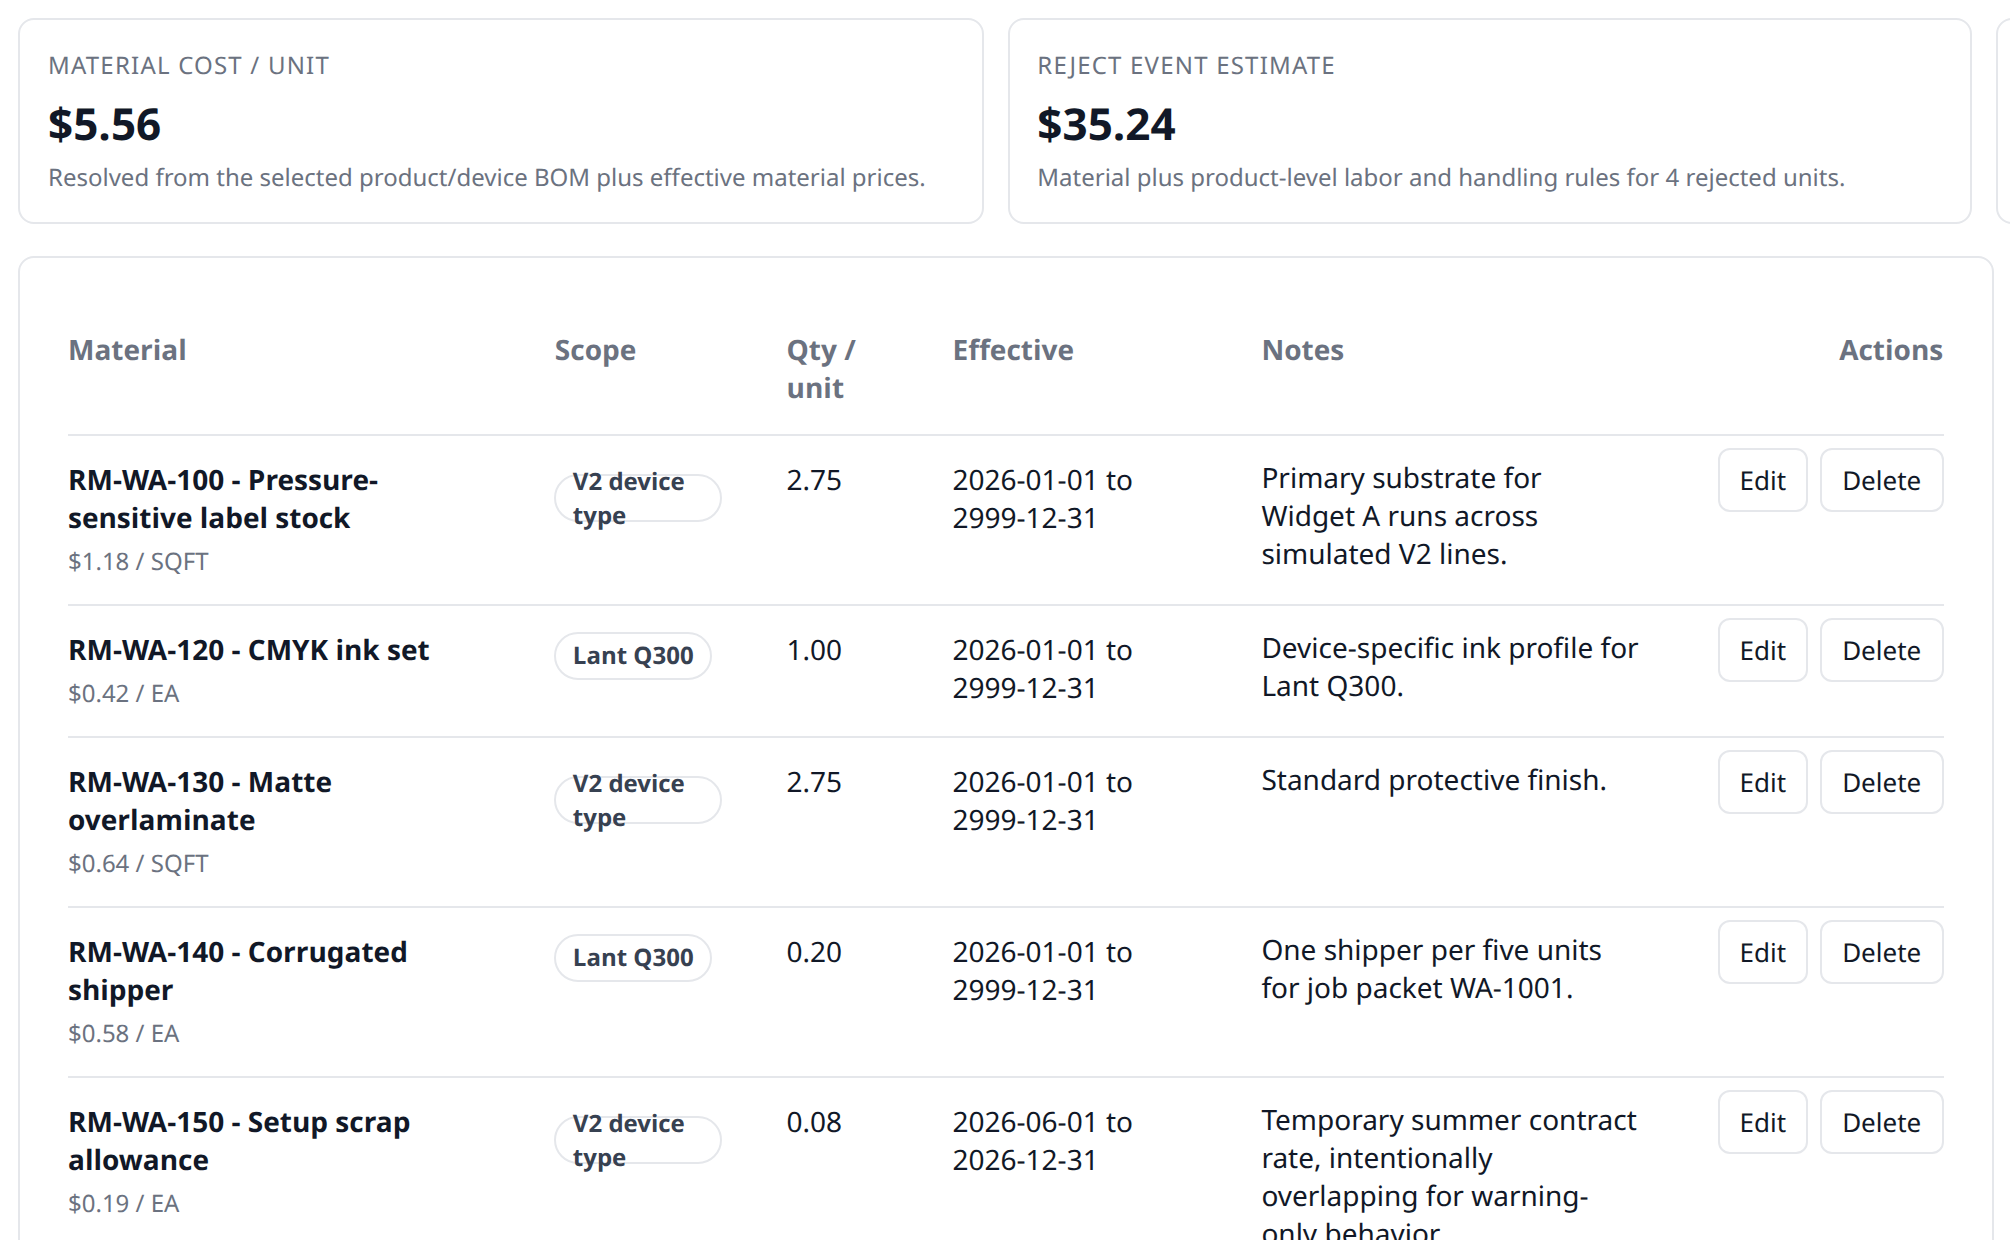
The paper packet that follows a job around the plant becomes shared data. Materials, quantities, labor routing, and job context travel with the run, so the floor and your production data finally describe the same job.
What Travels With Every Run
One shared definition, read by every product in the suite
Job header
Job, customer, product, due date, line, order quantity.
Bill of materials
Materials, components, packaging, part numbers, descriptions.
Quantities and units
Planned amounts in the units the floor uses: kg, lb, ea, ft, cases.
Labor and routing
Operations, expected labor, standard hours, machines in sequence.
Measured on the Floor, Priced by Costing
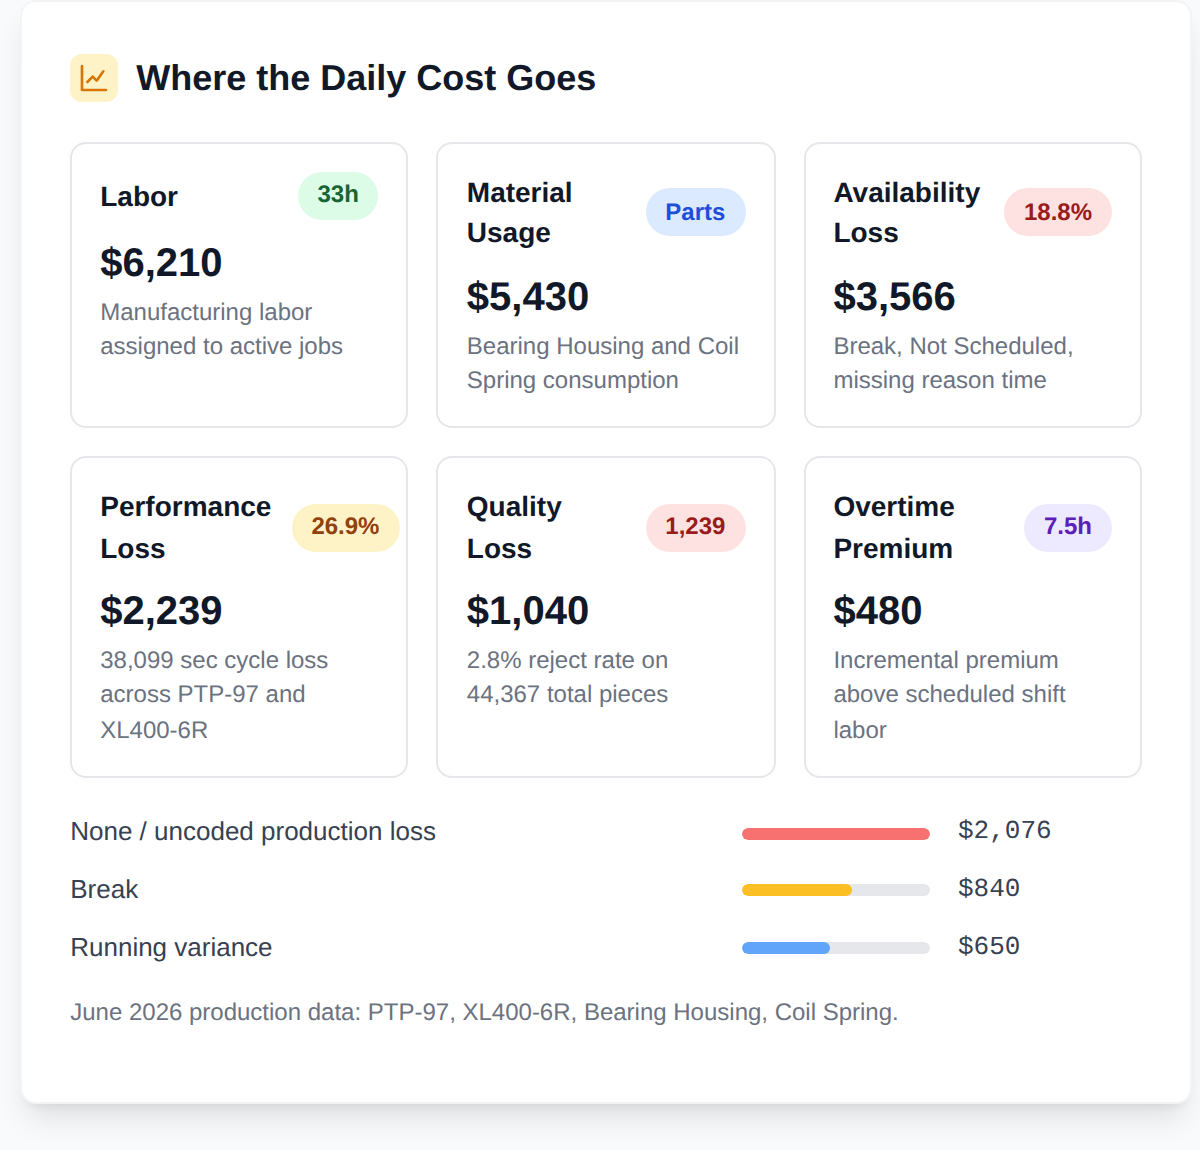
The same events your boards already capture, converted into money. Figures illustrative.
From Percentages to P&L
Costing sits on top of the production data you already collect. You configure what things cost - labor rates, material standards, the value of an hour of capacity, the overtime premium - with effective date ranges so historical runs stay priced correctly. From there every stop, reject, and slow cycle carries a number.
Load Your Costs and Your BOMs
Set plant cost tables by category and date range, and bring product bills of materials and labor routing in from your ERP or by import.
Losses Get Priced as They Happen
Downtime, rejects, slow running, labor, and overtime are converted into cost against the job that incurred them, using the rates in force at the time.
The Whole Suite Speaks Dollars
Explorer charts cost beside OEE, Advisor answers cost questions in plain language, and the improvement everyone has been arguing about finally has a payback number.
Where the Numbers Show Up
Costing and BOM feed the products your team already uses
OEE Explorer
Cost sits beside OEE on the dashboards: what each loss category costs, by line, shift, part, and reason, over any period you choose.
Advisor
Ask what downtime cost on a line last week, or which reject code is the most expensive in the plant, and get the dollar answer in plain language.
Work Tracker and Pulse
Operators see the active job's materials and routing step while they work, and supervisors watch each live run against its packet.
Continuous Improvement
Every proposed fix gets a payback number, and the board tracks whether the saving actually showed up in the months after.
Opportunity Costs of Downtime
Beyond the dollars already spent on a stop: what that lost capacity could have produced, by line, reason, and shift.
A full guided demo on your own production data is available on request.