
OEE Advisor
Ask Your Production Data a Question. Get a Real Answer, as a Number, a Chart, or a Sortable Table.

Stop Waiting on a Custom Report
The question you have at 7am does not need a ticket, a report request, or a week
Ask in Plain Language
No query language, no dashboard hunting. Ask the way you would ask a colleague, and follow up in the same conversation.
Answers as Charts
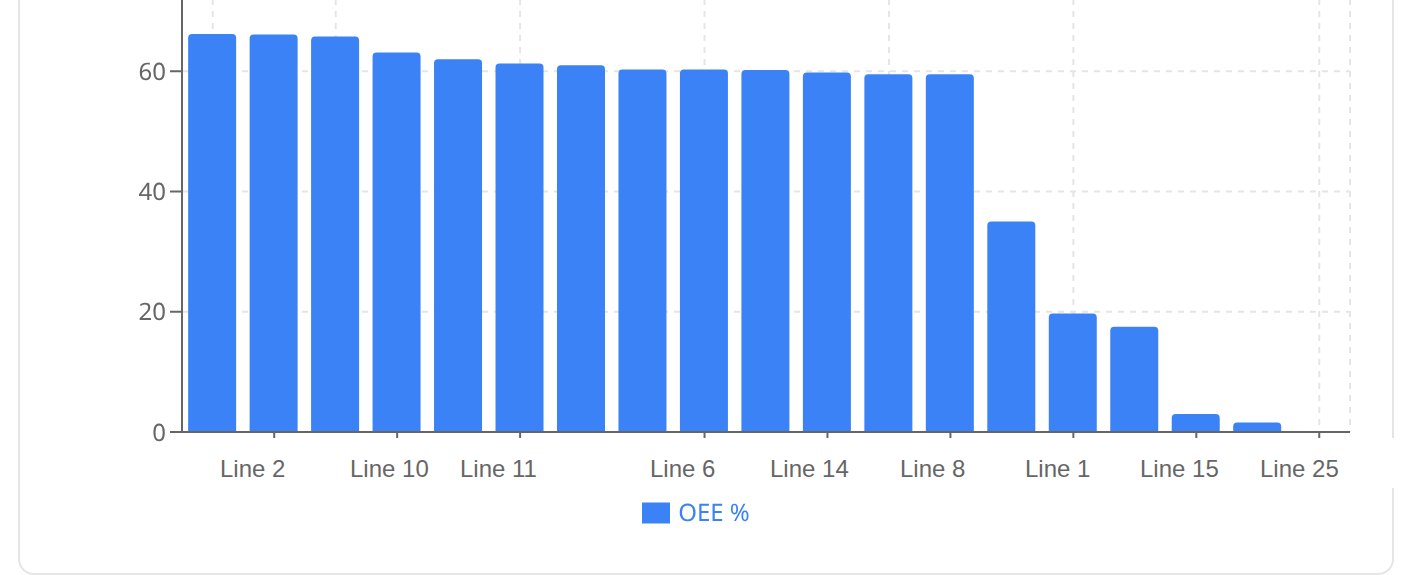
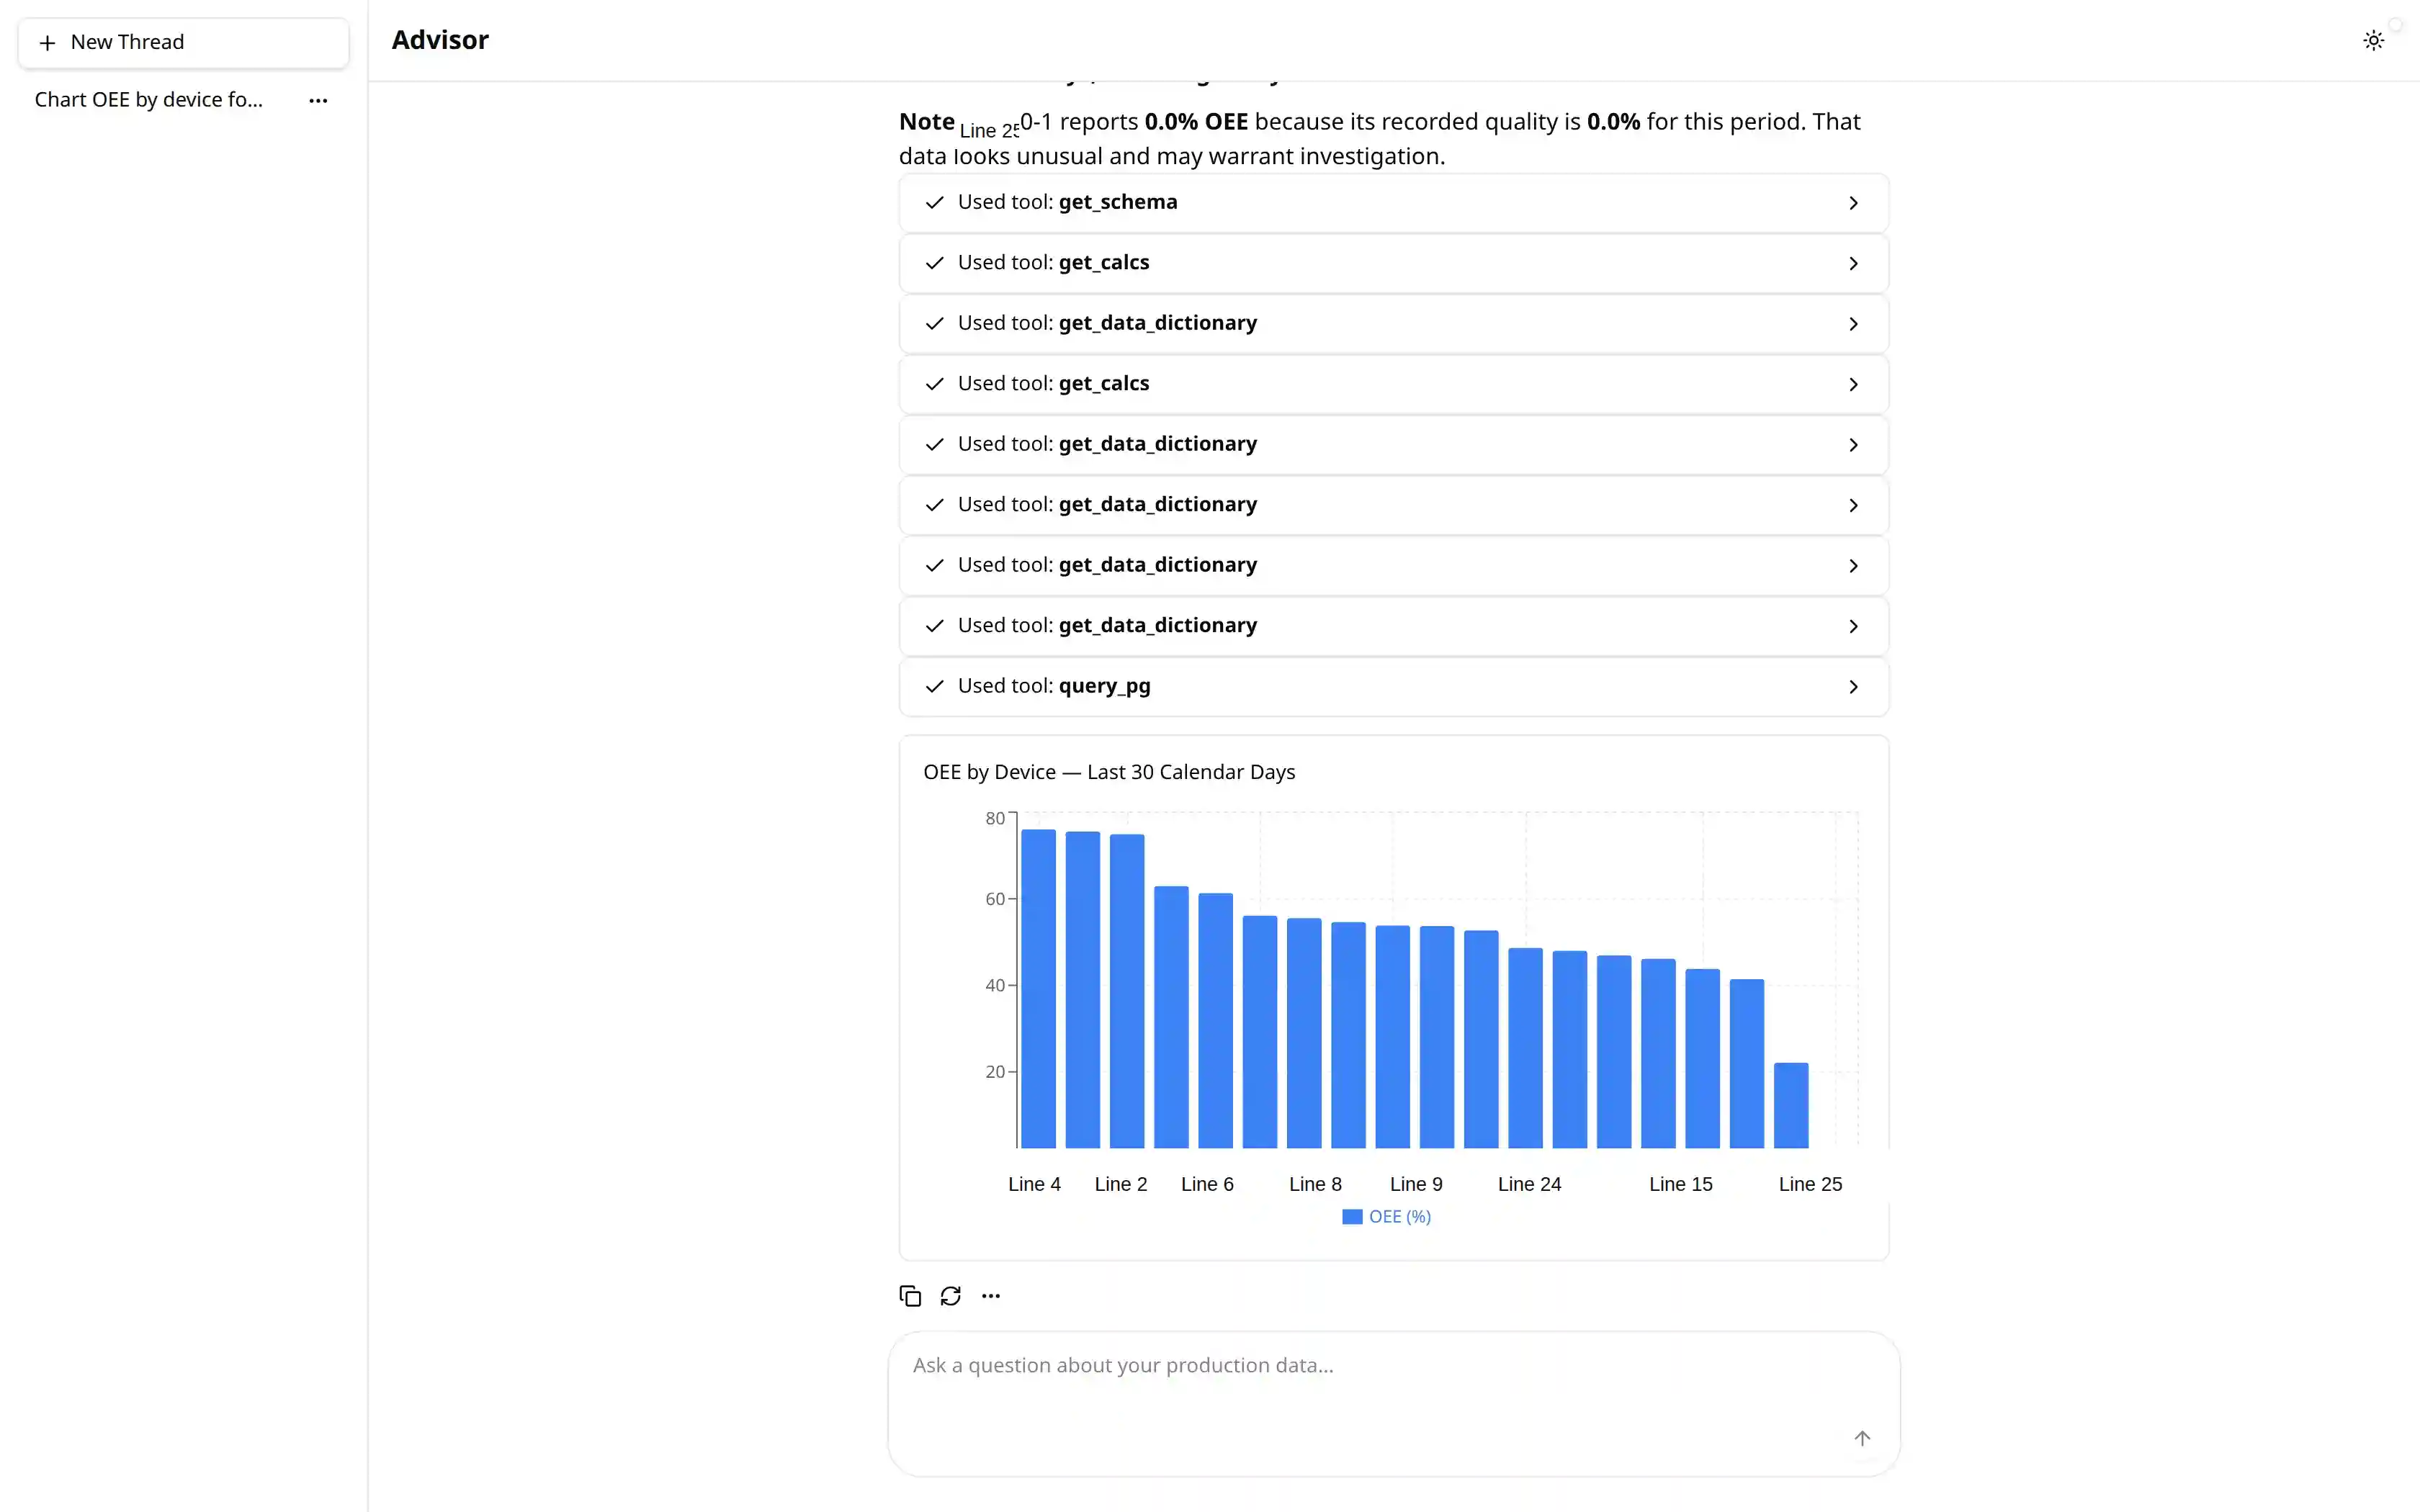
Ask for a chart and get one, built from the rows your data returned. Trends, comparisons, and breakdowns render inline.
Sortable Tables
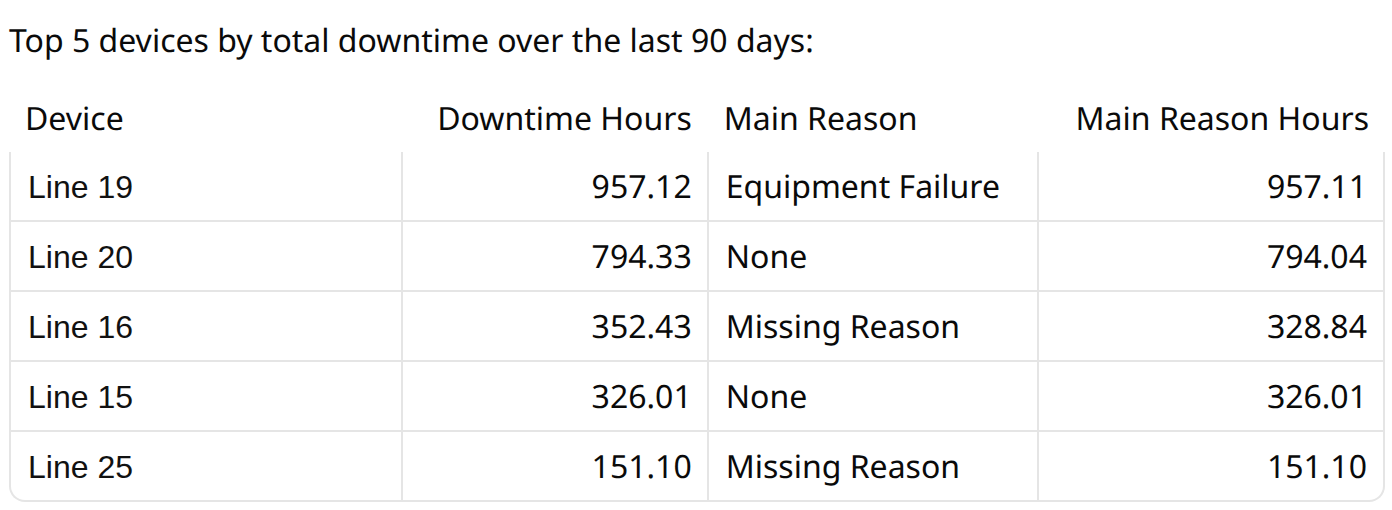
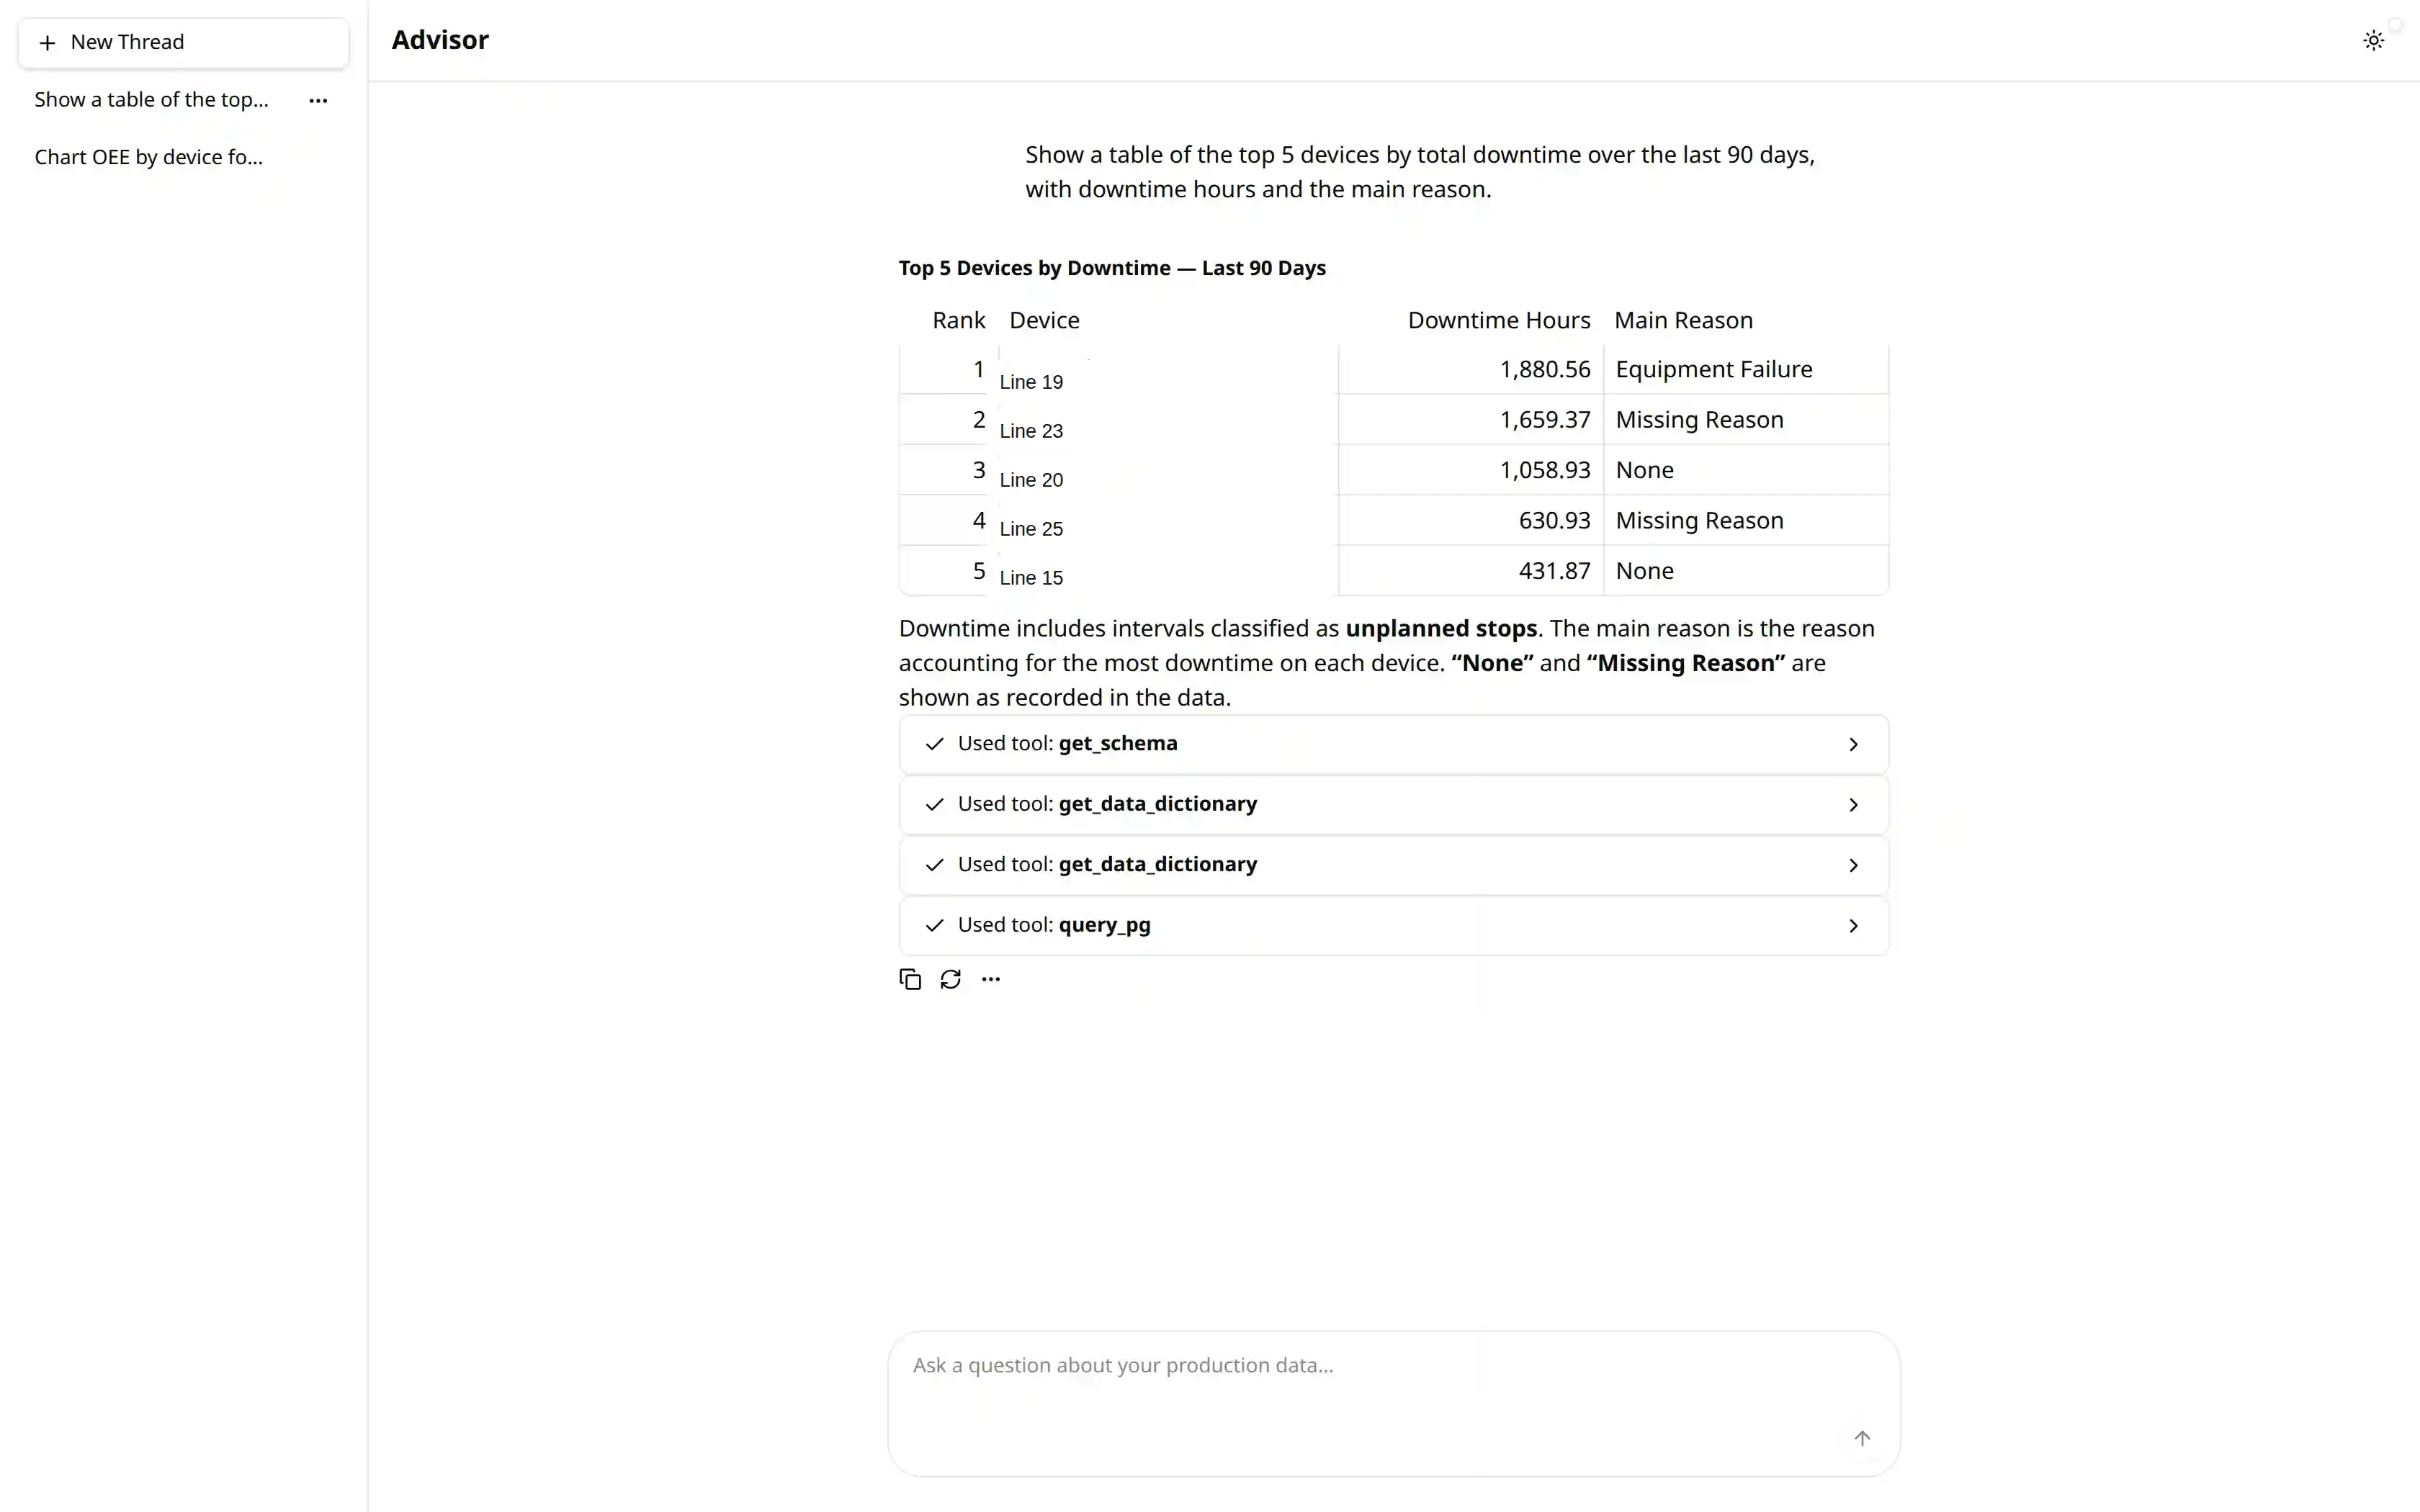
Ranked results come back as a real table you can sort and read, not a paragraph you have to pick numbers out of.
It Shows Its Work
Every answer carries the trail of tools and queries behind it, so any number can be traced back to the data it came from.
Read-Only by Design
Every query runs read-only against your production database. Advisor answers questions; it never changes your data.
It Stays on the Floor
Advisor answers production questions: OEE, downtime, quality, jobs, and parts. It declines off-topic and people-comparison questions.
The Same Question, Two Ways
Advisor picks the shape that fits the answer, and you can always ask for the other
The Answer, Not the Dashboard
That Might Contain It
Your production data already holds the answer. Finding it usually means knowing which dashboard, which filter, and which time range. Advisor removes that step: ask the question, get the number, and see exactly where it came from.
Real Questions, Real Answers
Every one of these is a question Advisor answers from your own production data
What Advisor Can Reach
 Pulse
Work Tracker
Explorer
Costing
BOM
Virtual Stations
Pulse
Work Tracker
Explorer
Costing
BOM
Virtual Stations

Grounded in Your Own Data
Advisor is not a general chatbot pointed at a manual. It queries your production database directly, read-only, and builds the answer out of the rows that came back. When a question needs data it cannot reach, it says so instead of guessing.
You Ask in Plain Language
Type the question the way you would say it. Advisor works out which devices, dates, and metrics you mean, and asks you to narrow it down when the question is genuinely ambiguous.
It Queries, Read-Only
Advisor runs its own queries against your production data using the same OEE definitions the rest of the suite uses, so its numbers match what your dashboards and reports already show.
You Get an Answer You Can Check
The answer comes back as text, a chart, or a table, with the trail of what it ran to get there. Keep asking follow-ups; the conversation holds its context.
Better With Every Product You Add
Advisor answers from whatever the suite knows about your plant
Pulse and Work Tracker
Live status, jobs, downtime, comments, and employee punches. Ask who was on a machine when it went down, and get the answer in one line.
Costing and BOM
Add cost and job-packet data and the same questions come back in dollars: what a reject code cost, what a stop was worth, how actual usage tracked to standard.
Multi-step and Batch Tracking
Ask about multi-machine lines and sequential batch steps once those runs share one tracked definition across the suite.
Continuous Improvement
Ask whether a fix actually held. Advisor reads the before-and-after and answers with the evidence rather than an opinion.
A full guided demo on your own production data is available on request.